Peter Drucker laid the foundations of modern management insisting that you can’t improve, what you can’t measure. In urban planning, this line of thought has transformed the way we set goals, track progress and analyze the effects of implemented projects and policies. Urban performance measures help communities make informed decisions and measure results against goals.
In this story we discuss some of the most important urban metrics to be taken into consideration when exploring the urban environment both on the neighborhood level and on a broader city-wide scale.
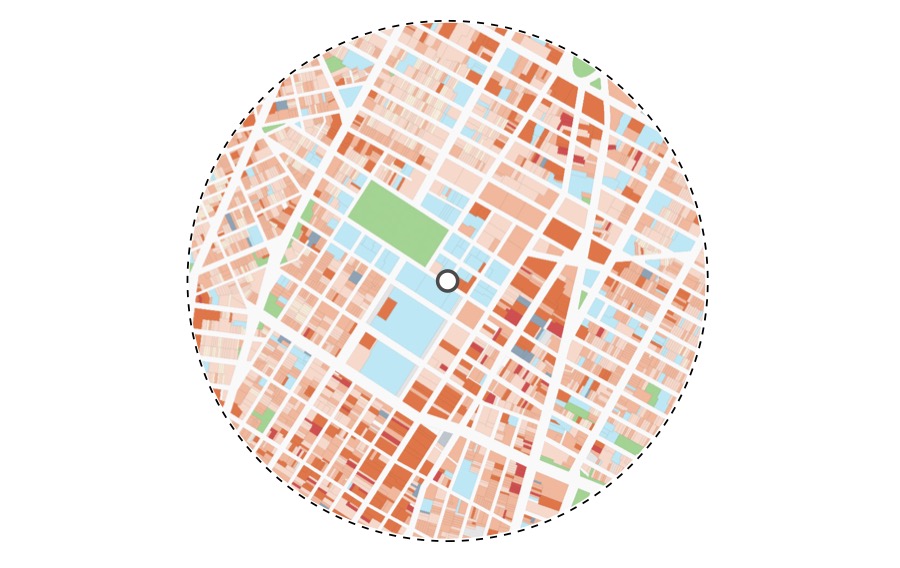
Land Use Mix
“A mixture of land uses has been shown empirically to encourage non-automobile based modes of travel such as walking and bicycling, which in turn are seen as having a positive impact on public health.” — Emily Tallen
Land use diversity is a key component of compact liveable communities where everything is within reasonable distances. This can range anywhere between 5 to 20 minutes of walking distance to a park, public space or a cluster of services. We explore land use data to determine access to public spaces and institutions, parks or even vacant land for future development.
This observation is helpful for establishing the number of potential destinations in a neighborhood and for drawing a more general conclusion on walkability. While public spaces and local centers act as anchors that allow people to meet and socialize, housing is the key to population density that actually brings people together.
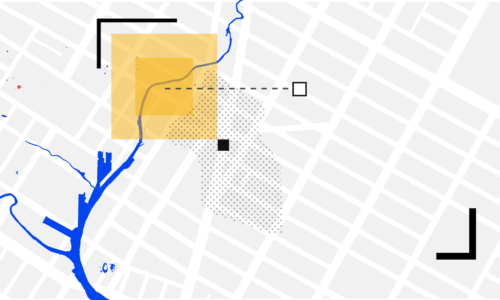
Destinations (Points of interest)
Points of interest provide a reason to walk. This can be a place to eat and drink that you just discovered on Foursquare, the nearby school from where you pick up your child every day or the local grocery store. Points of interest may be clustered around a local center or distributed along a main street.
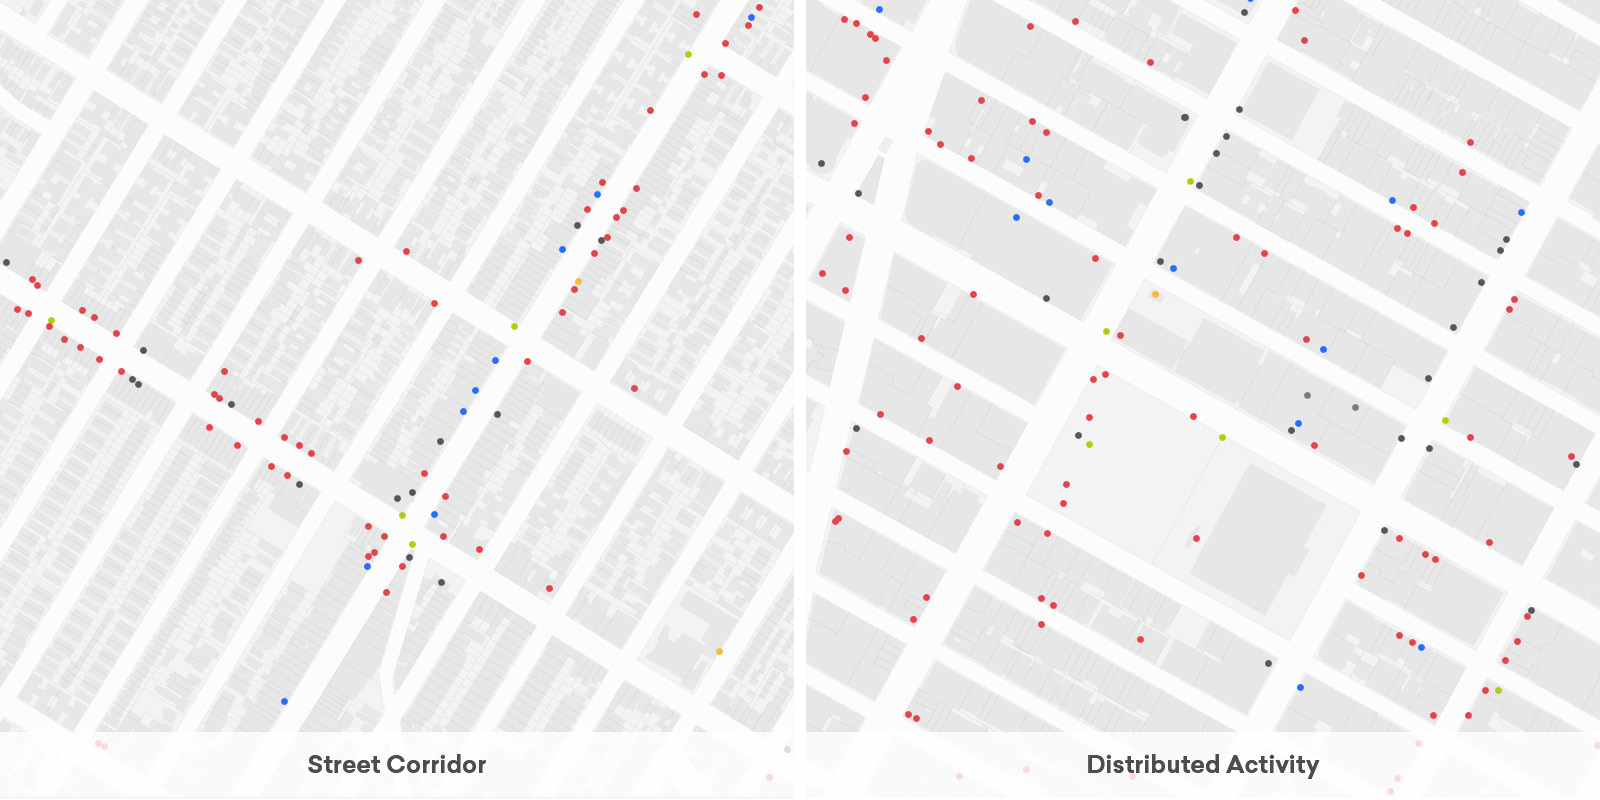
Ground level commercial activity provides not only a reason to walk. It also ensures transparent facades, more eyes overlooking the street and a safer urban environment in general. Points of interest can also include medical facilities, high-density residential or office buildings, places of worship or any location that attracts people.
Case study: Zagreb’s Green Horseshoe
Programming land use sometimes requires building a public consensus around an idea. And this process needs agile planning moves. A great example of this kind of strategic design is the work of Milan Lenuci in the city of Zagreb, Croatia.
Between 1860 and 1920, Zagreb became a stage for a series of strategic planning moves. During that period, the city’s surveyor – architect Milan Lenuci – choreographed public events, organized fairs and built temporary structures in order to transform vacant sites into a new public core.
“The process by which the Horseshoe was generated was actually the inverse of the process that had generated the Vienna Ringstrasse” — Project Zagreb
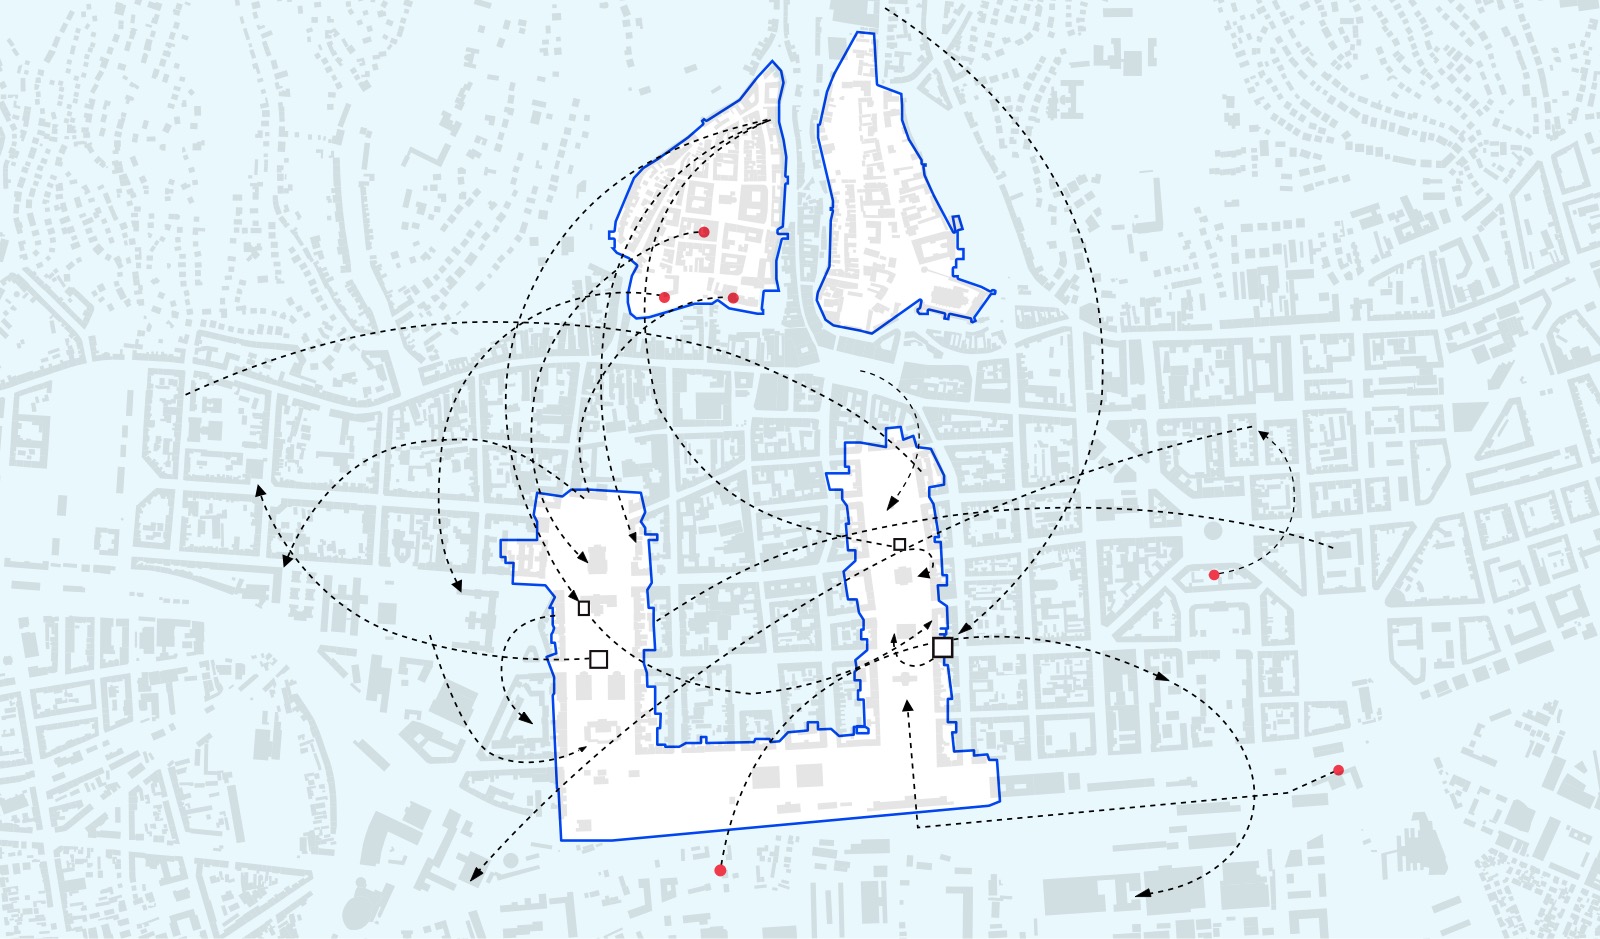
Inspired by Vienna’s Ringstrasse, Lenuci envisioned a new town center in The Lower city – the area between the railway and the old city center. Through a series of interventions and informal planning practices, he programmed the space and preserved it from future development long before the Horseshoe actually appeared in regulation plans.
To fix the figure of the Horseshoe as a new urban center, Lenuci began to build public awareness of the area as a new place for recreation. The space was dedicated to tennis and soccer in the summer, while during winter it was transformed into an ice skating park. One by one institutional buildings such as the National Theater, University Library, Chamber of Commerce and School of Arts and Crafts were built on the site.
Density
“It’s not how dense you make it, it’s how you make it dense.” — Saskia Sassen
Compact and connected urban environment is the ultimate anti-sprawl strategy as we try to reduce our carbon footprints and reverse the effects of climate change. Denser cities encourage walking, allow for shorter trip lengths and complement the benefits of mixed land use.
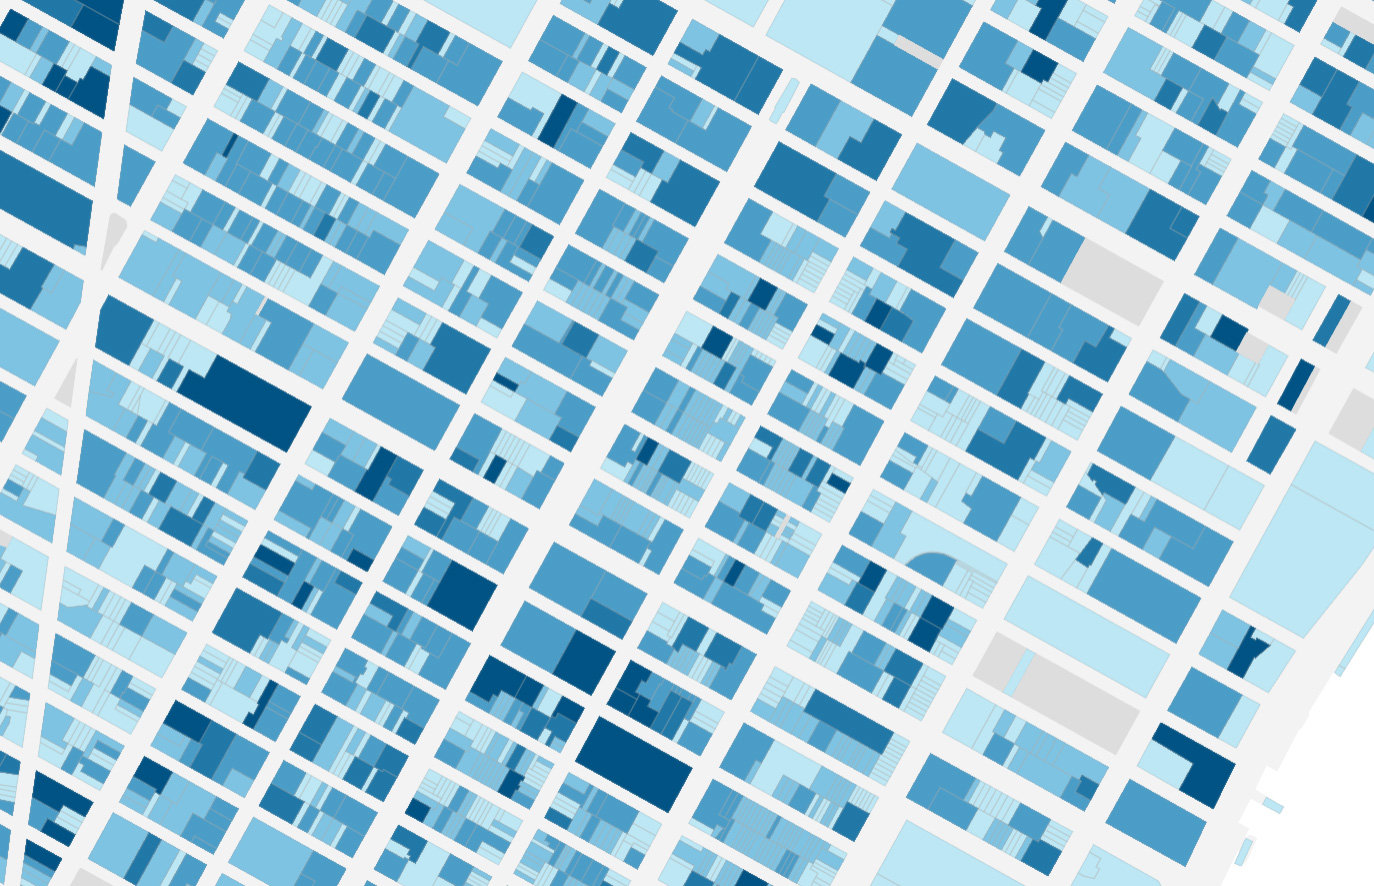
There are different ways to measure density but the three most common metrics are population density, floor area ratio (FAR) and the number of dwelling units per land area.
- Population density refers to the number of people living in a unit of land area
- FAR is defined as the relationship between the total usable floor area of a building and the area of the lot upon which it is built.
- Dwelling unit density refers to the number of homes in a land unit.
Intersection density
“Together, intersection density, block length, and travel lane width determine 70 percent of walkability.” — Douglas Farr
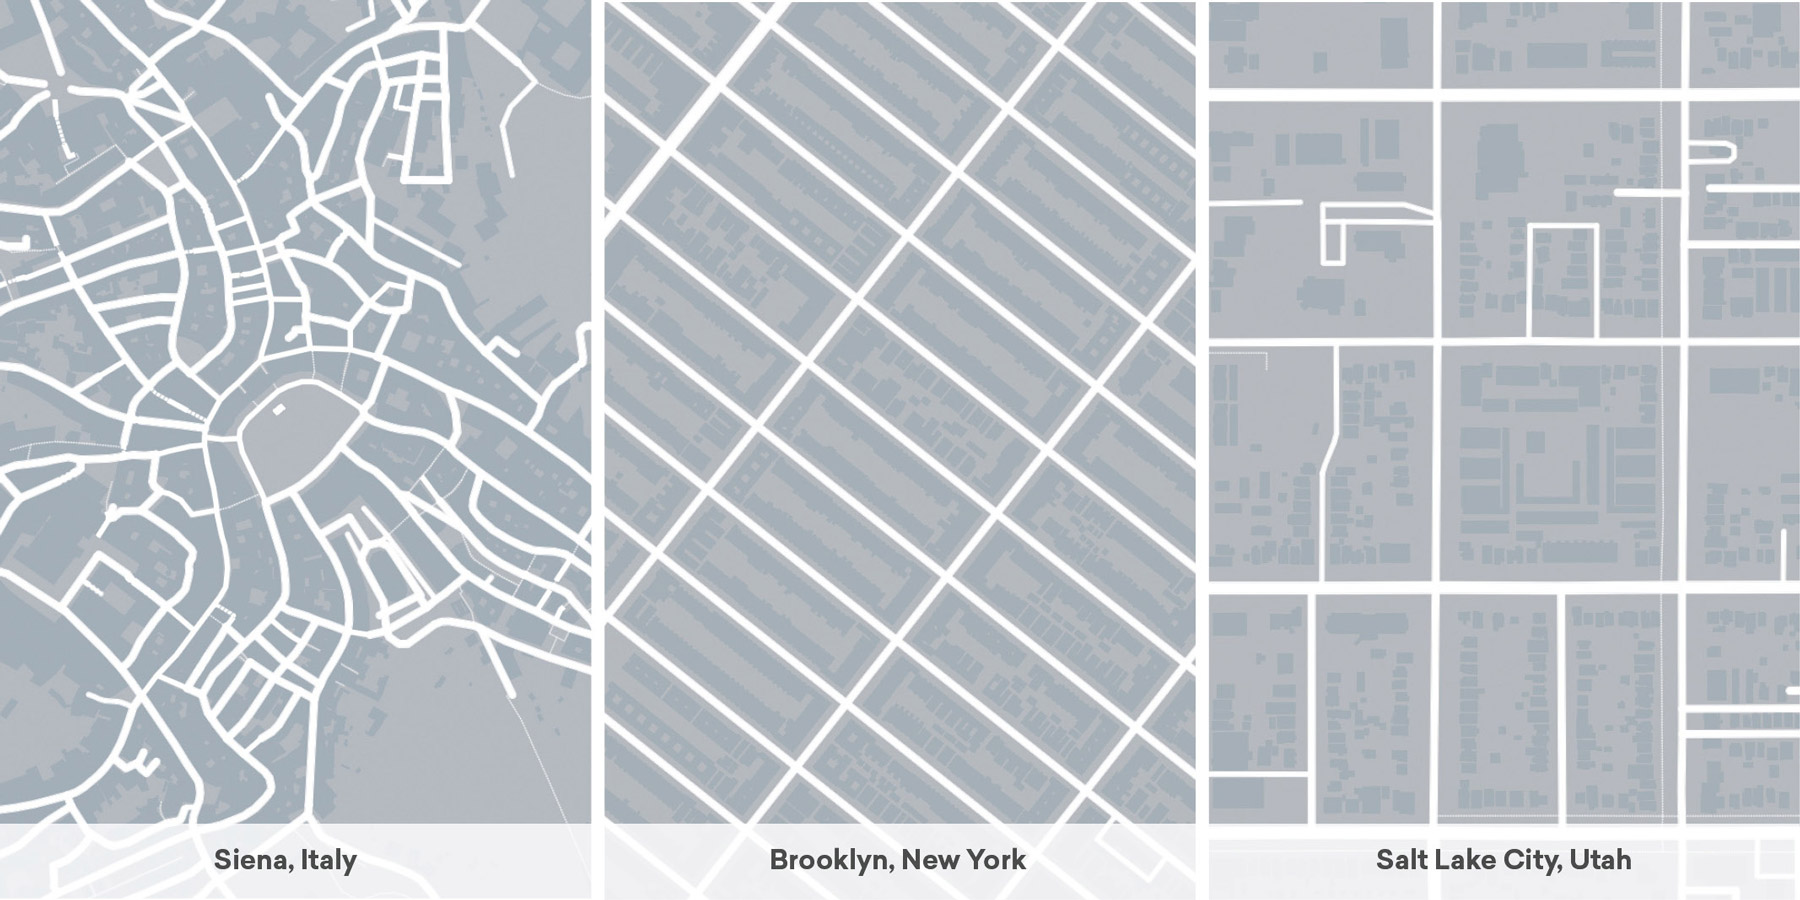
Intersection density is closely related to the block size and respectively – to the scale of the city. It refers to the number of intersections in a given area. A well-connected street network allows for shorter trip lengths and encourages walking.
In her seminal work “The Death and Life of Great American Cities”, Jane Jacobs identifies short blocks as one of the generators of diversity. As Jacobs states, shorter blocks result in more intersections and ultimately – in more opportunities for people to meet.
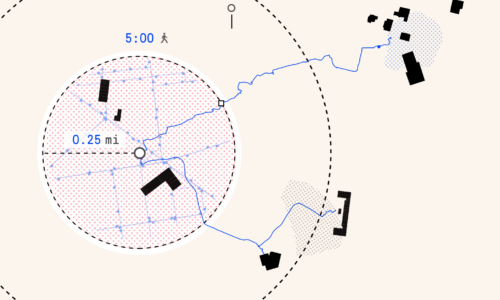
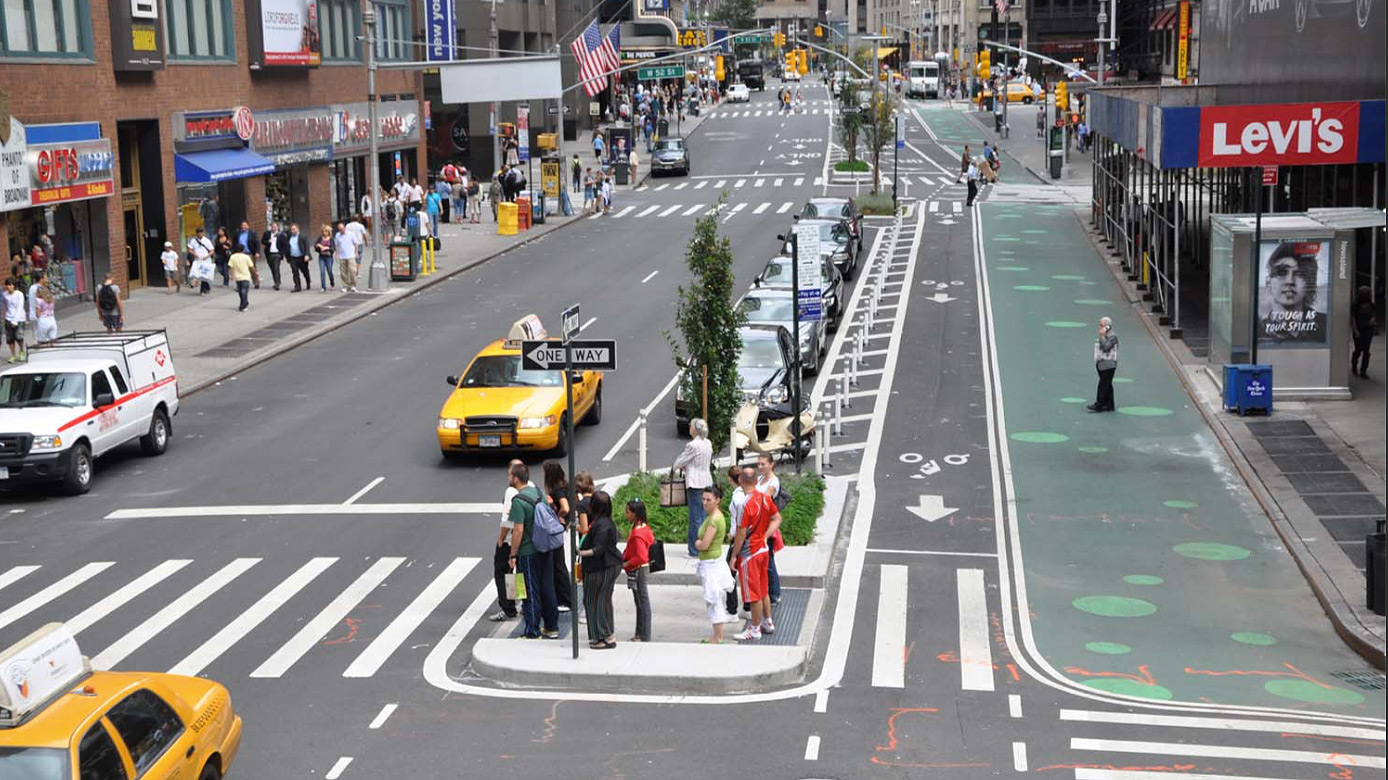
Mobility
Mobility metrics evaluate a city’s ability to allow flows of goods and people to move efficiently. These metrics usually observe volumes, capacity and travel times. For example pedestrian volumes, number of transit riders or the number of people in private motor vehicles are key performance measures.
“Total person movement and total person capacity are primary performance measures for transit streets that encompass the current and long-term potential of a street to serve the city.” — NACTO
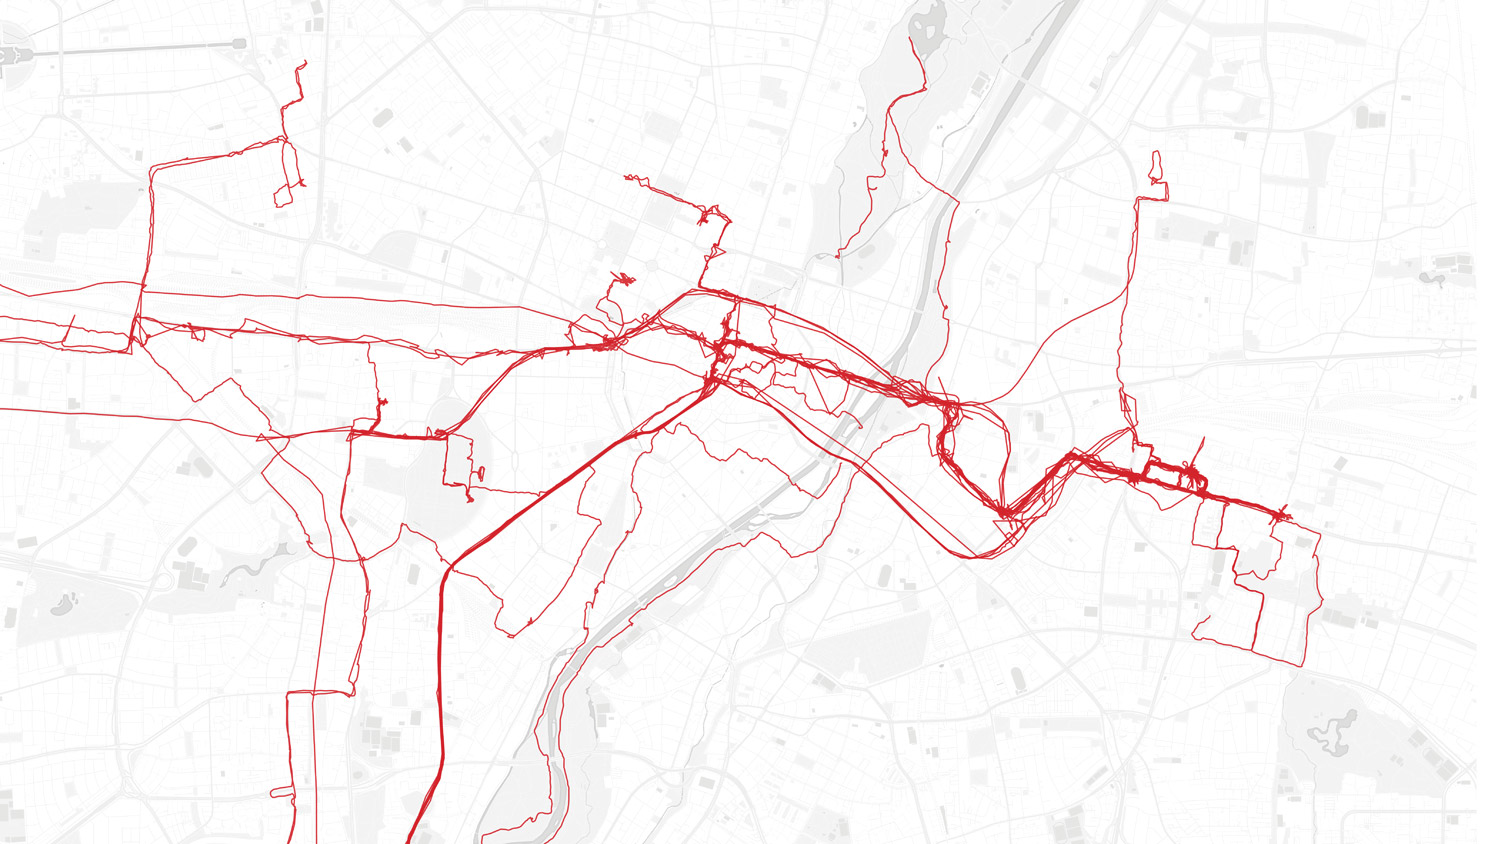
Mobility can also be measured in terms of access to destinations in set amounts of time or simply by the number of transit stops within walking distance. Research suggests that most people are willing to walk for about five minutes before opting to drive. That is why the 400-meter buffer (0.25 miles) is usually applied around bus stops and the 800-meter buffer (0.5 miles) – around rail stations.
Safety
“When you double the block size, you quadruple the number of fatal accidents on non-highway streets” — Jeff Speck
Safety can be measured by the number of car crashes or the proportion of pedestrian and cyclist fatalities in road traffic accidents. It also refers to crime statistics and includes datasets on felony, misdemeanor or violation crimes reported to the local police department.
But safety can also be a perceived quality of the urban environment corresponding to the number of people engaged in stationery activities on the streets (public space canvassing).
Street design has a direct impact on safety. For example, reducing street width can limit speeding, improve the pedestrian experience and encourage walking. That is why “skinny streets” programs have been implemented in cities all around the world.
Economic vitality
Changes in travel patterns, spending patterns and neighborhood desirability caused by changes in the street environment can impact businesses’ and property owners’ bottom lines, most directly by affecting retail sales but also by affecting, among other things, retail rents, office rents, and commercial property values.” — NYC DOT
A city’s economic vitality depends on a number of factors: some of them are location-specific, while others reflect its connection to global transaction chains. In general, there are two driving forces that lead to the concentration of jobs and economic activity in densely populated urban areas. Scale economies encourage the formation of large business and production establishments, while agglomeration economies encourage businesses and services to cluster together. And this is what ultimately attracts people in the compact setting of a large city.
There are numerous indicators for economic vitality. Data on new development in square footage or financial investment; real estate sales; rent and property values are all metrics that should be taken into consideration. Demographic data on employment rates; access to jobs and services also reflect a city’s economic prosperity. On the neighborhood level, local retail sales are great short and mid-term indicators for evaluating the effects of streetscape improvements, renovation and capital projects.
Demographics
Census data is one of the best sources of demographic insights and allows to isolate trends both on the micro level of the neighborhood and the macro level of the entire city. We can observe how population declines over time, identify displacement processes or enclaves of ethnic minorities.
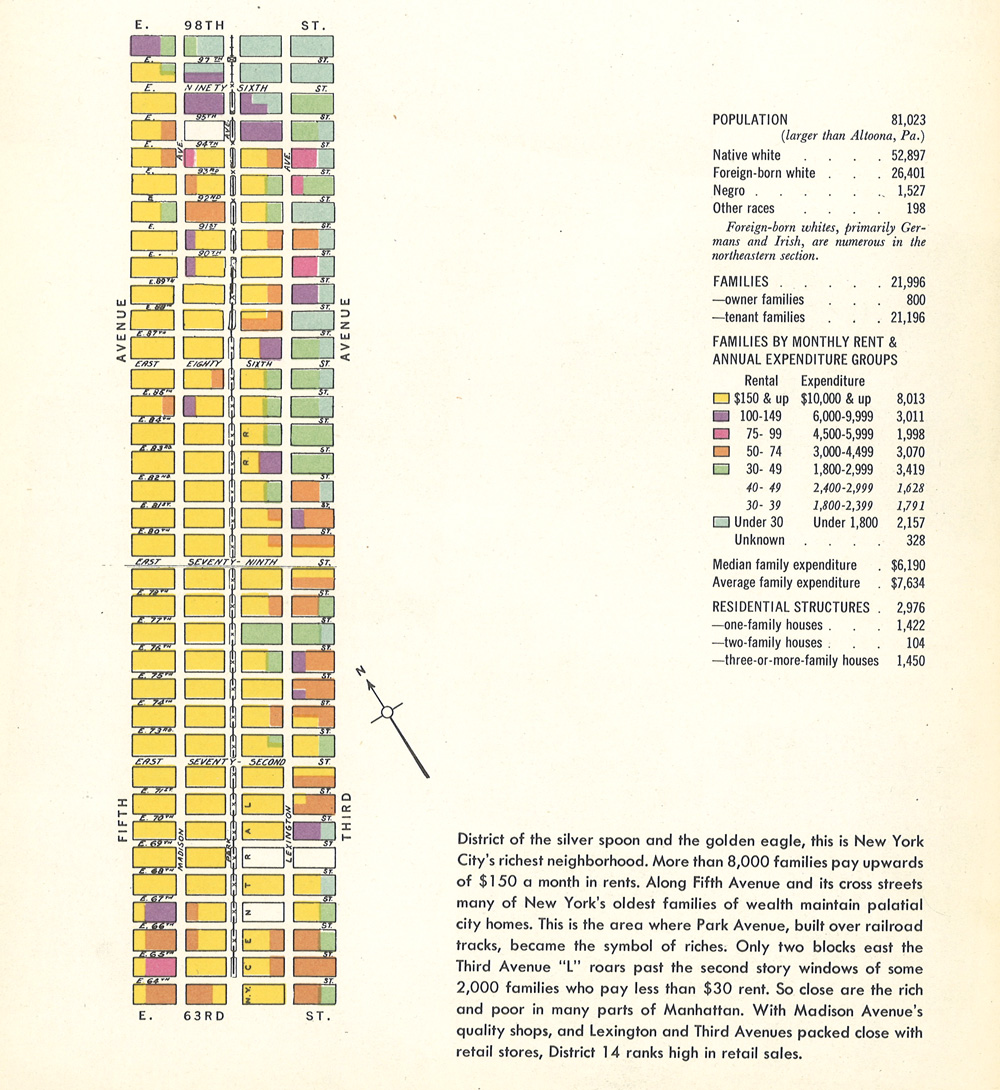
Besides race and ethnicity, household income and poverty rate are key demographic metrics. When paired with data on education, labor market and crime these metrics provide a socio-economic profile of the population. That is why census data is key for identifying signs of gentrification and racial inequality.
Comfort and design
The quality of public space is a snapshot of the quality of life in a city. Well designed public spaces have good pedestrian, bicycle and transit connectivity. They also provide comfort and multiple opportunities for people to socialize.
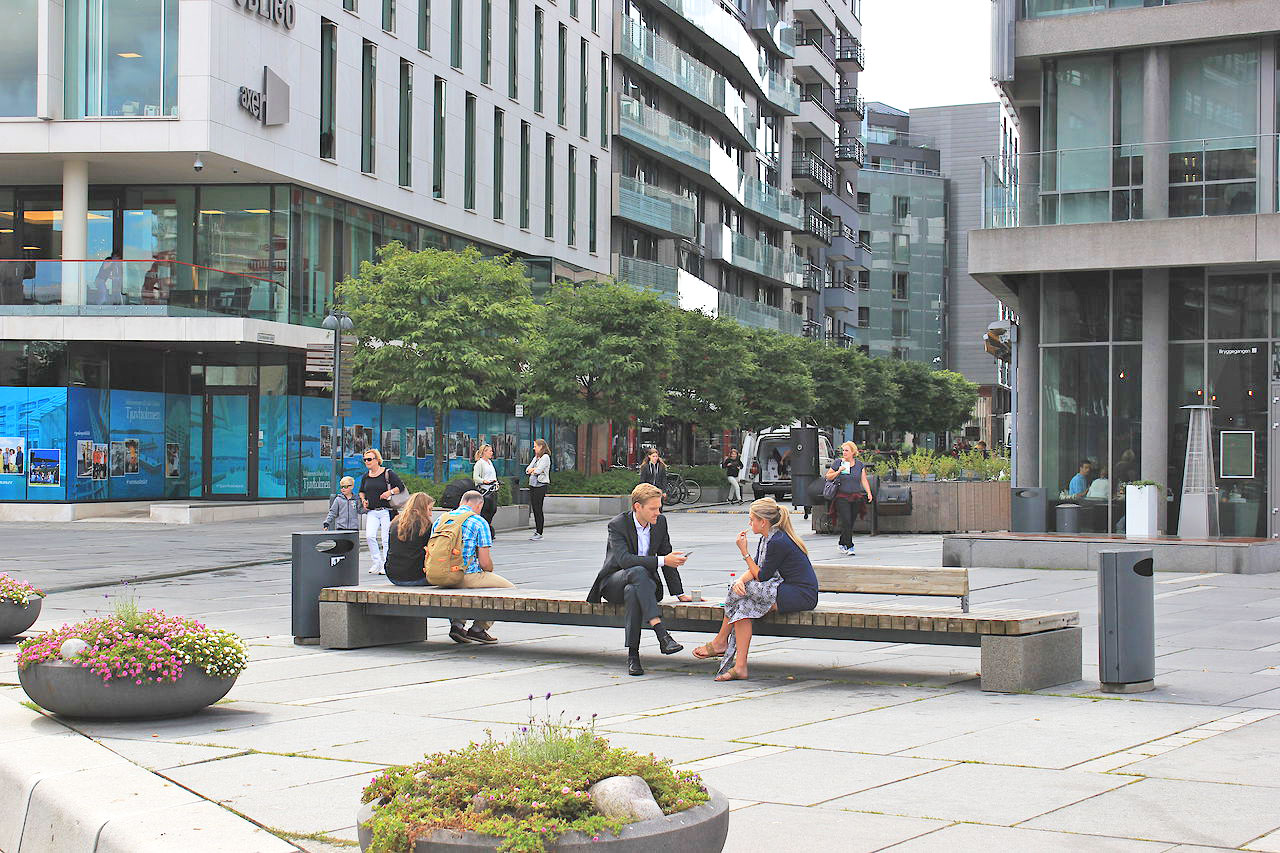
A comfortable place to sit and enjoy street life requires benches and all the other benefits of a vibrant urban environment such as street food, public events or simply a fountain ledge to relax on. The presence of tree canopy and shade, as well as the quality of the light and the availability of ground-level activity are essential for bringing people together.
Another important metric for a comfortable walk is the sidewalk width and the ratio of building height to street width that affects our sense of enclosure. A 1:3 ratio is considered to be the golden standard that allows people to experience a comfortable walk and seek both prospect and refuge.
In the last few months we’ve been working on a new tool called Location explorer. It will allow you to explore various urban performance measures, one neighborhood at a time!
You can subscribe in the form below to receive updates on the project:
Readings
1. Blau, E. (2007). Project Zagreb – Transition as Condition, Strategy, Practice. Barcelona: Actar. Blau, E., Rupnik, I. eds.,p.66
2. Brueckner, J. K. (2011), Lectures on Urban Economics, MIT Press, Cambridge, Massachussets.
3. Conor Semler, et al. (2016), Guidebook for Developing Pedestrian and Bicycle Performance Measures
4. Ewing, R, Cervero, R, (2001). Travel and the built environment: A synthesis. Transportation Research Record number 1780, 87–114
5. Farr, D. (2018). Sustainable nation: urban design patterns for the future. Wiley, p.330
6. Saskia Sassen. Talk based on her book Expulsions: Brutality and Complexity in the Global Economy
7. Speck, J. (2012). Walkable City: How Downtown Can Save America, One Step at a Time. New York
8. Speck, J. (2013). The walkable city, TED talk
9. Tallen, E. (2008). Design for Diversity: Exploring Socially Mixed Neighbourhoods. Routledge Equity, Justice and the Sustainable City series, p.39
10. The Economic Benefits of Sustainable Streets Report by NYC DOT (2013)
11. Transit Street Design Guide by National Association of City Transportation Officials. Island Press ISBN: 9781610917476.

Learn with Morphocode
Our video course Mapping Urban Data is now available!
It contains 30 carefully organized and beautifully illustrated videos that will lay a solid foundation for your mapping skills.