“A Notebook is an interactive, editable document defined by code. It’s a computer program, but one that’s designed to be easier to read and write by humans.” — Mike Bostock
Interactive notebooks provide a great interface for iteratively running code, exploring results and visualizing data. They allow you to mix narrative, rich media and data in a single story that can be shared and reproduced.
Notebooks are composed of cells. Each cell can contain text, code, images or other elements such as maps and graphs. You can run code cells, explore the output, tweak the code and re-evaluate the result. This iterative workflow makes notebooks a great tool for exploratory data analysis and visualization.
At Morphocode, we use notebooks to clean, refine and analyze datasets, merge different sources together, build dataviz prototypes and explore new ideas. In this post, we’ll review some of the popular interactive notebooks and talk about how you can use these tools in your work.
Working with data
“When we look at the future and we try to think what does it look like to work with data, we think it looks an awful lot like a notebook experience.” — Michelle Ufford
Usually, the heavy data lifting is done by data scientists, statisticians and software engineers. But there’s an increasing number of people coming from other backgrounds — designers, city planners, policymakers, journalists, analysts, etc. — that also need to make sense of the data.
In this context, the interactive notebook can provide common ground for technical and non-technical people. According to Michelle Ufford — head of Data at Netflix — notebook usage will continue to grow and will shape how we work with data in the future.
Some of the most popular interactive environments are Jupyter notebooks (formerly iPython notebooks) and R Notebooks. There’s also an increasing number of JavaScript-based notebooks built on top of the Node.js ecosystem. Such examples are RunKit, nTeract and Observable.
Let’s start with the most popular interactive notebook — the Jupyter Notebook.
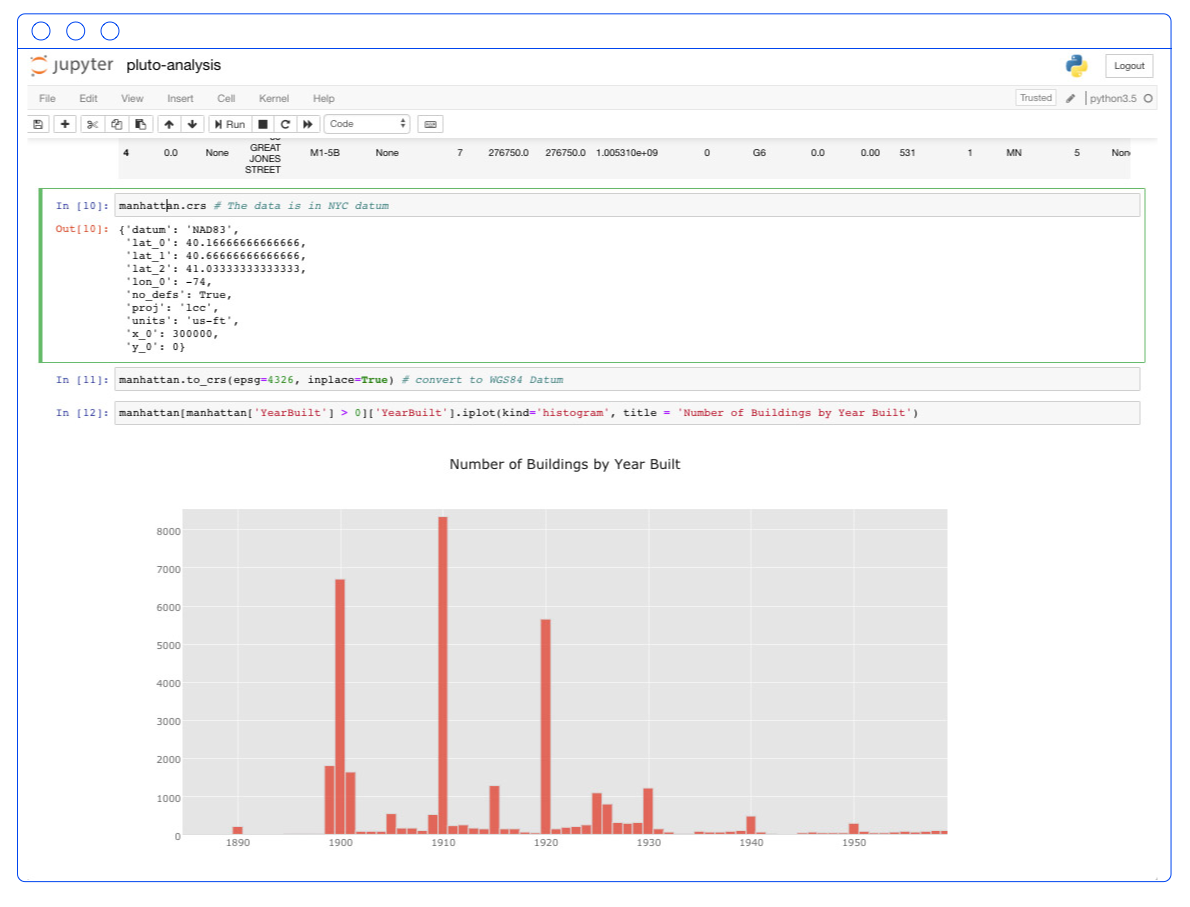
Jupyter Notebooks
Project Jupyter is an open-source project developed by a large community of contributors. It is used by many academic and business organizations including Google, Netflix, Microsoft, Berkley and NYU.
The Jupyter notebook is composed of two key modules: a User Interface and a Kernel. The UI is where you edit the notebook by adding cells, writing code and explaining your findings. It is a web application that runs in your browser.
The Kernel, on the other hand, is where your code gets executed. It is a separate process that runs outside of your browser. When you run a code cell, the Kernel computes the result and sends it back to the browser, where you can continue working with it.
This separation between UI and Kernel makes Jupyter notebooks highly modular. You are not restricted to a single programming language – there are kernels for Python, R, Scala, JavaScript, Go, etc.
You can install Jupyter notebooks locally by following the installation instructions here. For more inspiration, check out this selection of notebooks or try out the interactive demo.
nteract
nTeract is a desktop application for creating interactive notebooks. Once you install it on your system, you can simply double-click on a notebook file to start editing it. The user interface is clean and minimal. It is based on React and provides nice features such as draggable cells, GeoJSON support and built-in charts via Vega and Altair.
nTeract is an open-source project developed by contributors and supported by the NumFocus foundation. By default, it comes with a built-in Node kernel allowing you to build JavaScript notebooks out of the box. The nteract ecosystem is growing quickly and includes Hydrogen – a plugin that turns Atom into an interactive computing environment, commuter – a browser for notebooks and papermill – a tool for parameterizing notebooks.
You can download nTeract at nteract.io and check out the git repo for notebook examples.
Geo Notebooks
GeoNotebook is another interesting project built on top of the Jupyter notebook. It provides a custom user interface by combining the classic notebook editor with a large interactive map. You can render geospatial data, select custom regions and perform location-based analysis.
GeoNotebooks are used at NASA and are especially well suited for working with raster geospatial data. Under the hood, the project uses a custom kernel. You can check out the project page for more information.
Observable notebooks
Observable is a newer addition to the landscape of interactive notebooks. The project is developed by Mike Bostock – the creator of d3.js along with a brilliant team of developers featuring Jeremy Ashkenas and Tom MacWright. It was announced back in 2017 under the name d3.express and was later renamed to Observable.
Observable notebooks have a strong focus on interactivity and visualization. They run directly in the browser and provide native access to graphics capabilities, including SVG, Canvas and WebGL. These notebooks are built using modern JavaScript and allow you to import any library published on npm including popular dataviz libraries such as d3.js, plot.ly, mapbox-gl, three.js, etc.
Just like traditional notebooks, Observable notebooks are composed of cells containing code, images, text, markdown, etc. What makes observable cells different is their “reactivity” – when you change a single cell, all related cells are updated – like in a spreadsheet. This reactive model, lets you focus on data exploration and story-telling instead of tracking data changes across cells. Under the hood, the observable runtime builds a dependency graph and figures out which cells need to be updated.
Observable notebooks offer a great environment to share your data discoveries, build data visualizations or engage readers in interactive stories. To get you started, check out the featured notebook collection.
R Notebooks
R Notebooks were announced back in 2016. They are part of the open-source development environment RStudio. As the name suggests, these notebooks are closely tied to the R ecosystem, giving you access to powerful libraries from the tidyverse such as ggplot2 and dplyr.
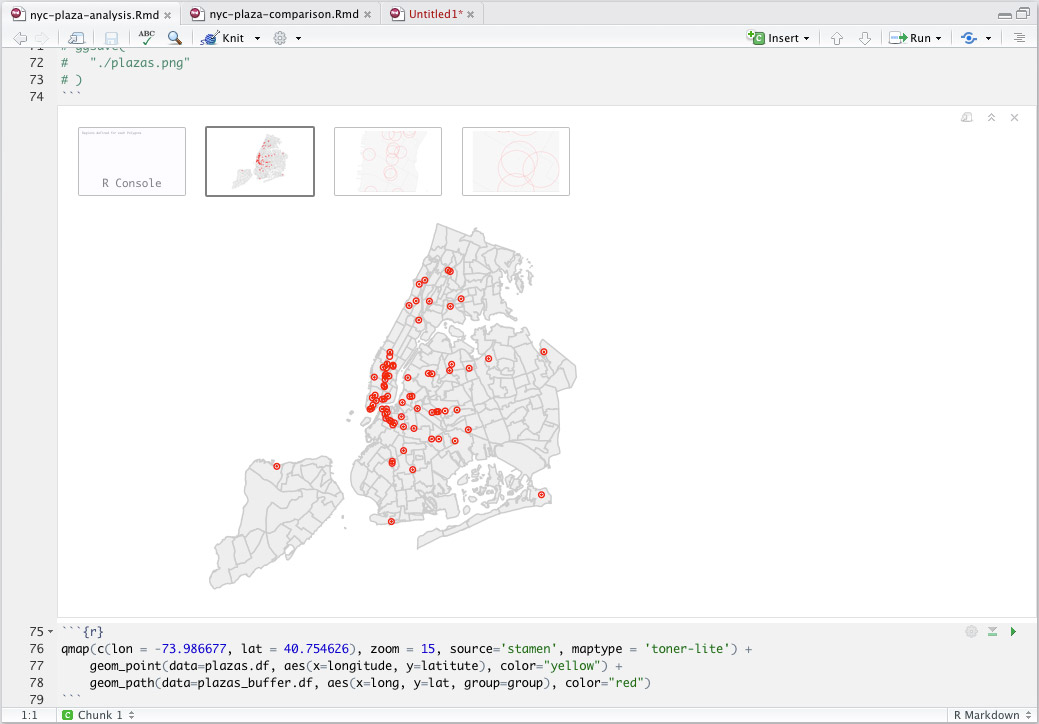
RNotebooks are documents composed of chunks that can be executed interactively. Unlike Jupyter notebooks, they are stored as markdown files, while their output is stored as a separate HTML file. Check out this introduction to get you started.
Collaborative environments
Collaboration is an essential part of the notebook model. When working in a team, you can use a central notebook server as an access point to your data, code and research projects.
JupyterHub allows you to share notebooks, so that each team member gets their own notebook instance. Colaboratory is another free notebook environment that runs in the cloud. It is developed by Google and allows you to save data to Google Drive, use custom widgets and explore various machine learning topics.
Our Workflow
In our work, we tend to use Python and JavaScript-based notebooks. Python offers access to powerful data analysis libraries such as pandas, geopandas and numpy, while JavaScript provides tools for interactive data visualization – d3.js, plot.ly, regl, leaflet, mapbox-gl, etc.
We pick a particular notebook environment depending on the project’s goal and the size of the dataset. Jupyter notebooks are effective when working with large datasets because the computation is done server-side – by the python kernel. Observable, on the other hand, offers a great interactive playground for building DataViz prototypes. It is a great fit when working with smaller datasets that can be rendered in the browser.
We often combine the two approaches by using python for the heavy lifting and Observable for data visualization and interaction.
Upcoming course
In our upcoming course, we’ll focus on urban data analysis and visualization. We’ll cover best practices in information design, popular DataViz libraries and data analysis workflows.
To receive updates on the forthcoming course, subscribe in the form below: