Tools augment our problem-solving capacity. We rely on them to expand our minds and provide ease, accuracy, and speed in our daily tasks.
Over fifty years after the invention of the first interactive graphics program, we can look back at the dawn of human-computer interaction to better understand the tools we use today.
The dawn of computer graphics
“I once asked Ivan Sutherland how could you possibly have done the first interactive graphics program, the first non-procedural programming language, the first object-oriented software system, all in one year? He said – Well, I didn’t know it was hard.” — Alan Kay
The father of computer graphics – Ivan Sutherland – didn’t learn how to read until he was in the third grade, and he never learned how to spell.
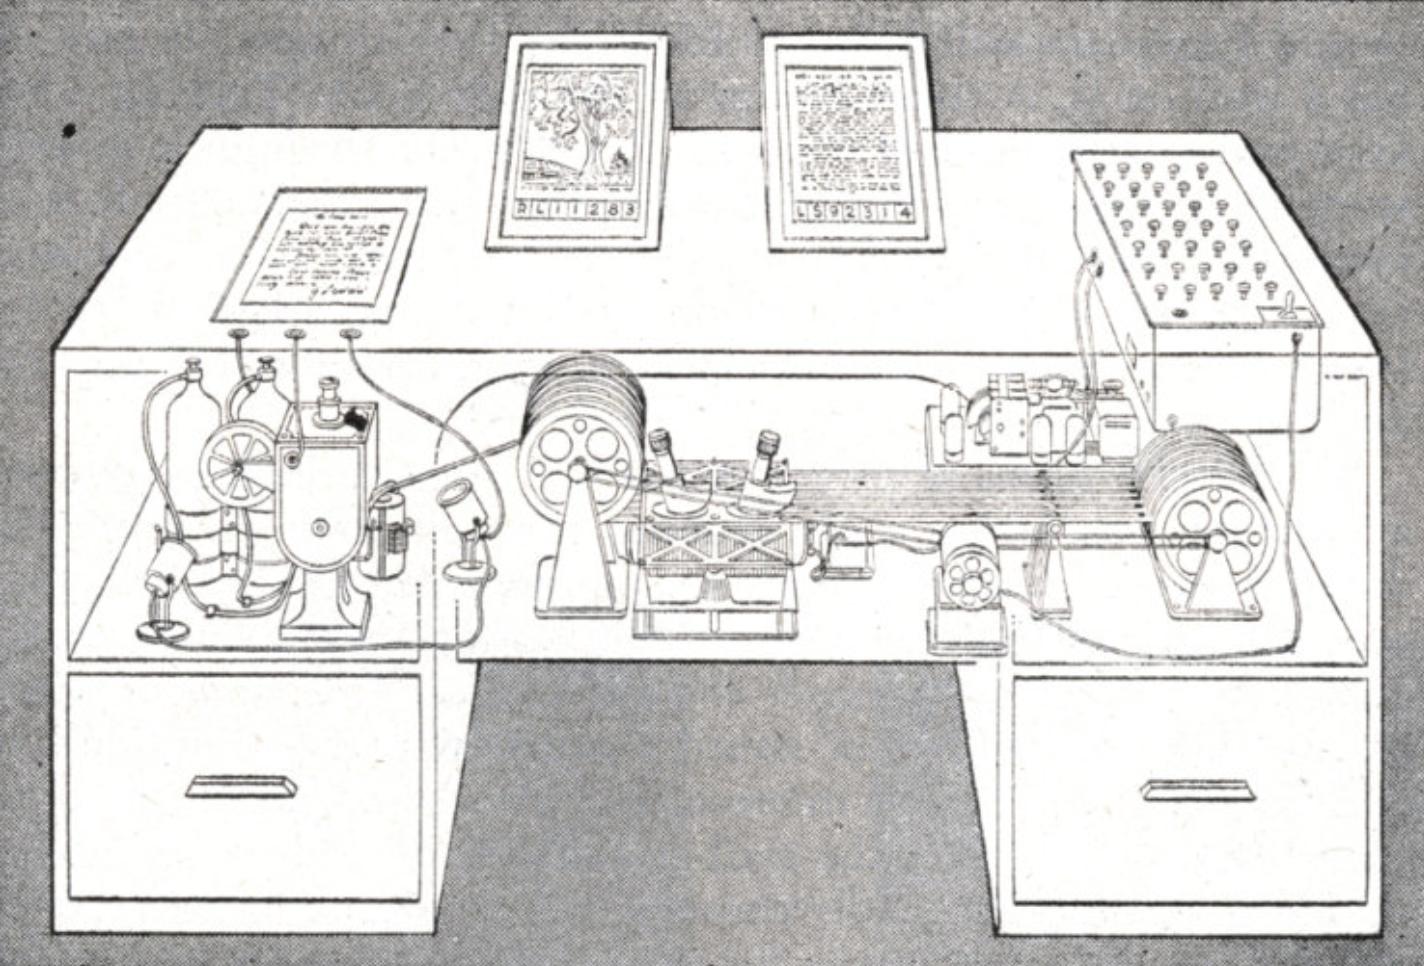
His fascination with graphics, however, was an early discovery. As a child, he was strongly influenced by Richter’s anchor stone sets and their rich instructional drawings.
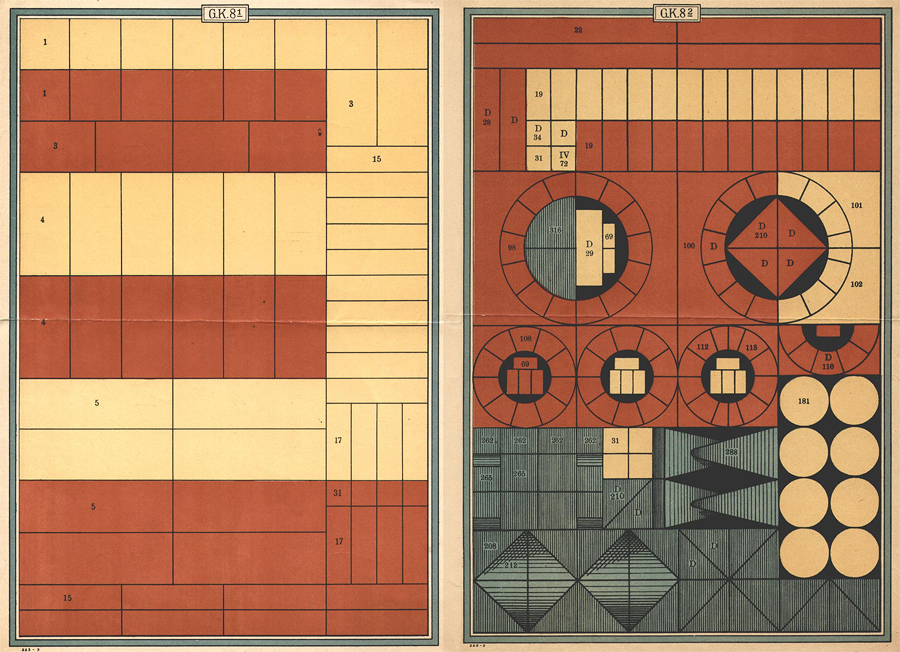
His love for graphics inspired Ivan Sutherland to create Sketchpad – the first program to utilize a complete graphical user interface. Ivan Sutherland believed that the program could contribute to the speed with which ideas could be tried and accepted or rejected.
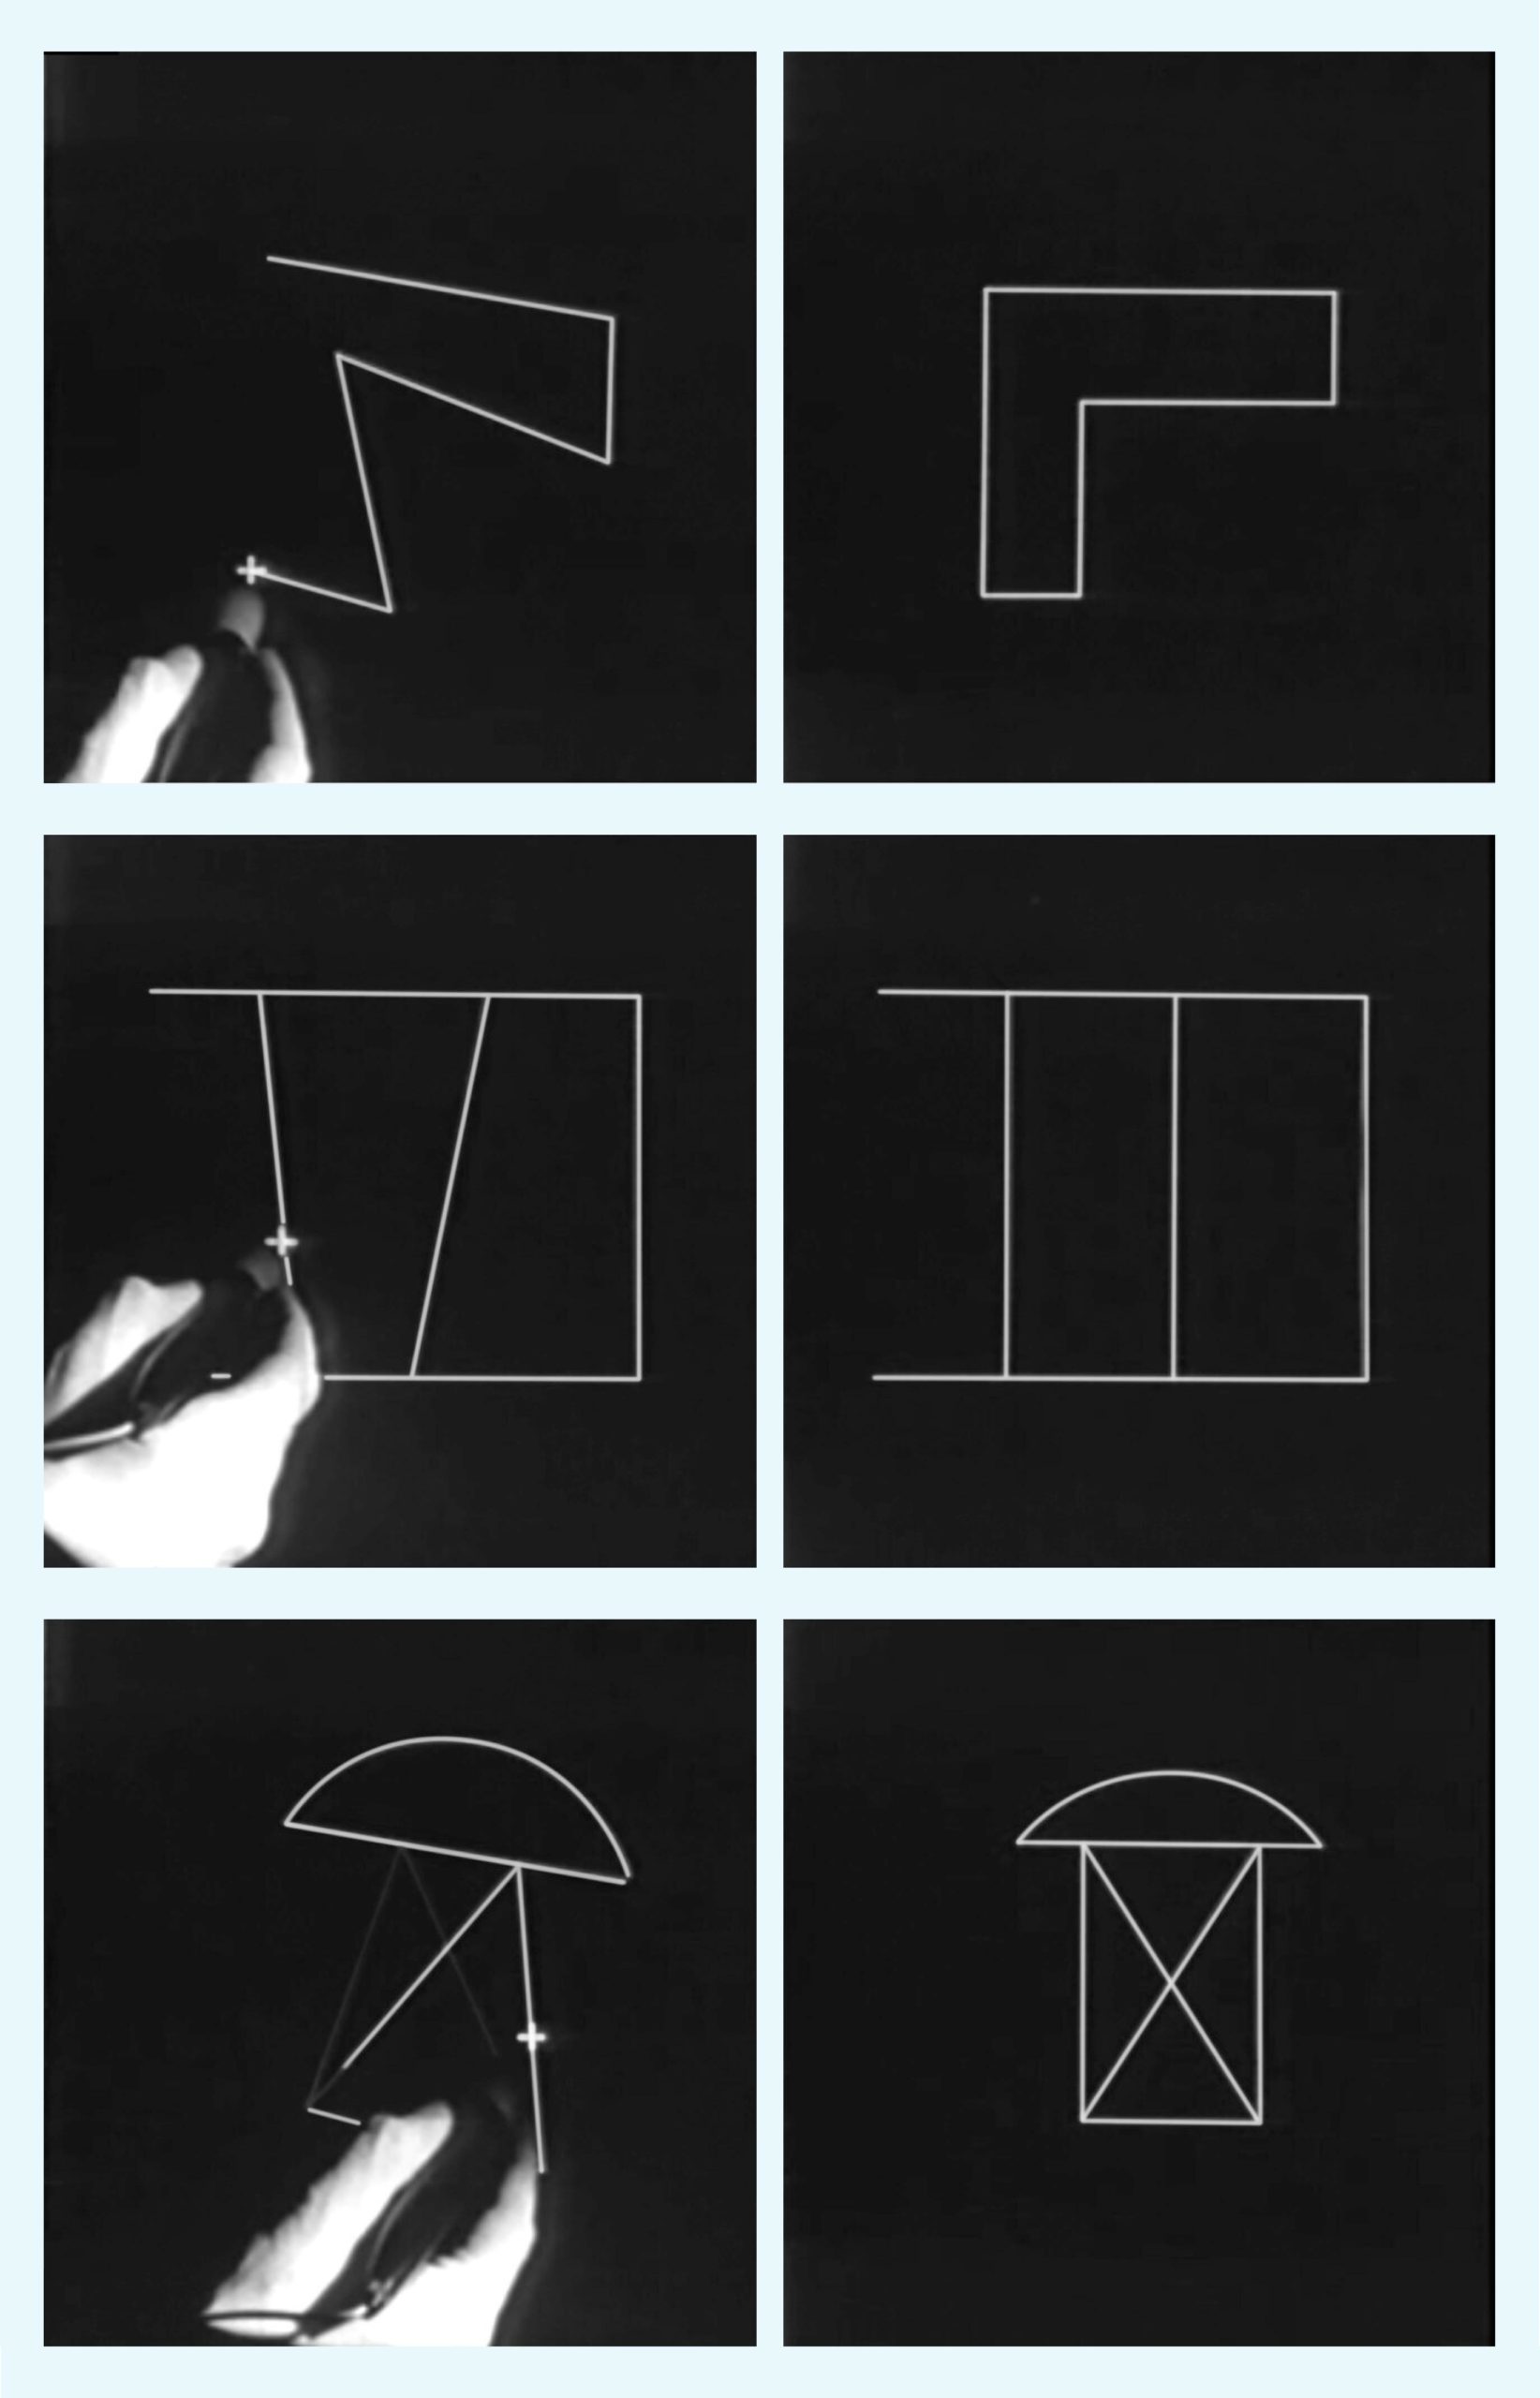
Sketchpad was an early precursor of modern CAD programs. It was a powerful graphical input tool and, according to Sutherland, opened up a new era of man-machine communication.
Augmenting human intellect
“By augmenting human intellect, we mean increasing the capability of a man to approach a complex problem situation, to gain comprehension to suit his particular needs, and to derive solutions to problems.” — Douglas Engelbart
You might be surprised to learn that the story of personal computing started on a remote island in the Philippines. A young electrical engineer who had joined the US Navy as a radar technician was waiting for the formal end of WWII on the island of Leyte. His name was Douglas Engelbart, and he had just stumbled upon an impromptu Red Cross library.
In the small bamboo hut, Engelbart discovered a source of inspiration for his future work. A recent article by Vannevar Bush entitled “As we may think.” This visionary essay depicted a future where machines could become a sort of collective memory which Bush called the memex.
“Consider a future device for individual use, which is a sort of mechanized private file and library. It needs a name, and, to coin one at random, “memex” will do.” — Vannevar Bush
The memex would help us store data and share information with the same speed and flexibility that is common to the brain. But unlike human memory, the associative trails built in the memex would never fade. This early vision for human-computer interaction had a huge influence on both Engelbart and Ivan Sutherland.
As WWII was coming to an end, the article urged the scientific community to now turn to “the massive task of making more accessible our bewildering store of knowledge.”
Engelbart responded to this call by dedicating his life to human-computer interaction. He was eager to design tools that augment our cognitive capacity and help us tackle what he later called problems of “urgent complexity.”
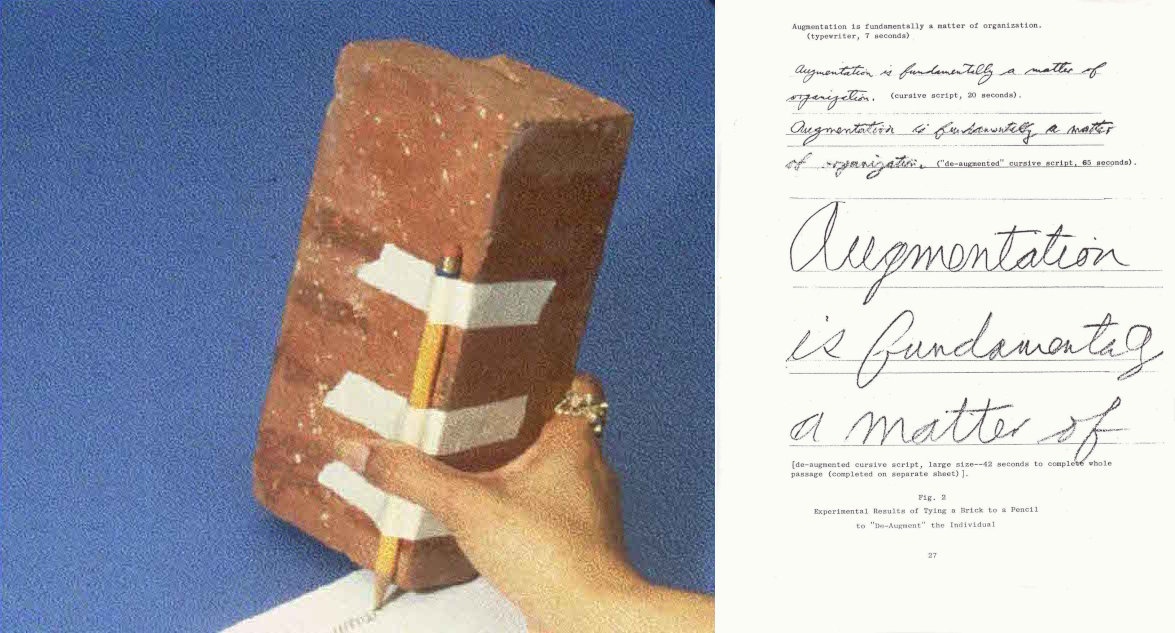
In 1963, he published Augmenting Human Intellect: A conceptual framework. The report featured his famous brick-pencil experiment illustrating in a simple but clever way how the right tools allow us to work faster and to be more efficient.
Speed matters
A few years after he published his conceptual framework, Engelbart illustrated his point on speed and efficiency in a far more sophisticated way.
On Dec 8, 1968, he held a 90-minute live presentation in San Francisco that became known as “The mother of all demos.” This landmark demonstration introduced to the world for the very first time the mouse, hypertext, collaborative text editing, version control, real-time video conferencing, and the window as a graphical control element.
“The time available for solving a lot of the problems is getting shorter and shorter. So the urgency goes up. So then I put it together that the product of these two factors, complexity and urgency, is the measure for human organizations or institutions.” — Douglas Engelbart
“The mother of all demos” was a paramount event in the history of personal computing and the culmination of Engelbart’s research. Following the steps of Vannevar Bush, he envisioned a world in which people “would communicate and collectively organize their ideas with incredible speed and flexibility.”
An early interactive map
The demonstration also included a curios predecessor of modern cartographic interaction. “So here’s what I drew with a picture drawing capability. – says Engelbart – Here is a slight map, if I start from work and here’s the route I seem to have to go to, to pick up all the materials.“
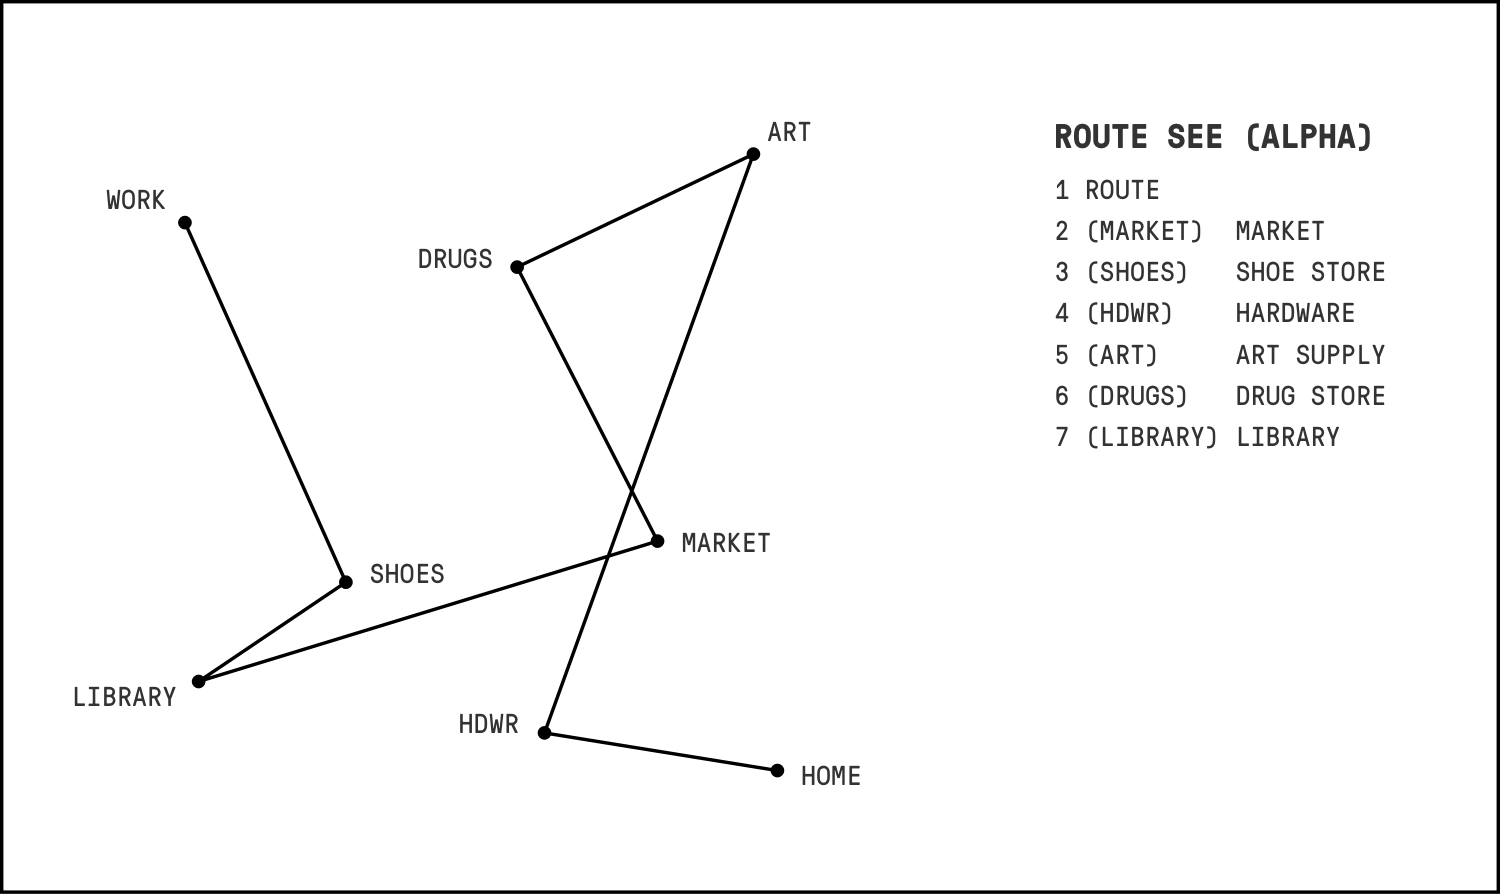
This schematic representation of Engelbart’s way home was a simple interactive map. Clicking on each location in the graph provided access to additional information.
During the demo, Engelbart also introduced the notion of “view control” and demonstrated how the same information could be displayed and organized in different ways. To illustrate the idea, he switches from a simple “to-do” list to a map view.
Tools and understanding
“The greatest value of a picture is when it forces us to notice what we never expected to see.” — John Tukey
As interactive graphics and human-computer interaction flourished, so did exploratory data analysis. Interactive tools became a means to “discover the unexpected”.
In 1977, John Tukey stated that finding structures in data requires two things: tools and understanding. As a statistician, he knew that assessing the future is always chancy, but he also knew that the tools we use affect how we approach a problem.
When designed to expand our cognitive performance, the tools we use, allow us to work better and faster, and ultimately – to stretch our understanding of complex phenomena.
A new frontier
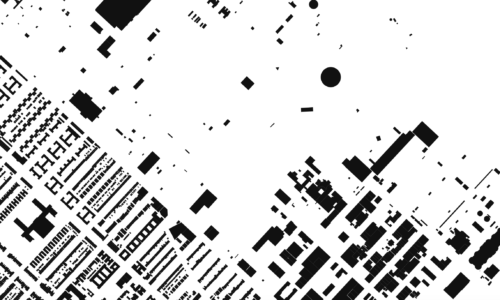
Today, modern web technologies allow us to work with interactive graphics at a great speed, directly in the browser.
Powerful new planning tools like Remix and UrbanFootprint enable city agencies and design professionals to be more efficient, conduct spatial research faster, and test different planning scenarios.
Platforms like OmniSci and Kinetica run on top of powerful GPU-based engines and allow users to perform analysis on large datasets.
A new culture of reactive documents and explorable explanations has influenced the way we explore and interact with data in both popular media and scientific research.
Observable notebooks, for example, offer a new reactive model and an excellent interface for iteratively running code and visualizing data in the browser.
Building interactive tools
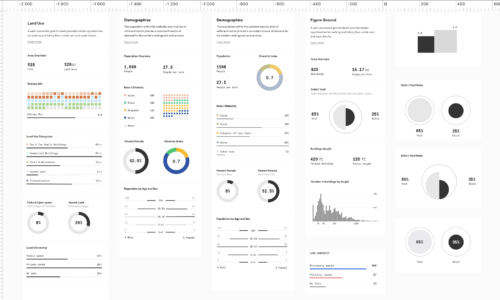
Speed and visual design were our primary focus when we started building Morphocode Explorer almost a year ago.
We reflected a lot on how to reduce the cognitive load associated with traditional GIS tools and provide a playful, yet powerful user experience.
Morphocode Explorer in action
You can now visit the website of the tool to learn more about the upcoming launch or download the “Data on a Human Scale” playbook and discover more about the research behind the tool.
References:
1. Brand, S. (1968). Whole earth catalog: access to tools
2. Engelbart, D. (1963). A conceptual framework for the augmentation of man’s intellect
3. Engelbart, D. (1986). The Augmented Knowledge Workshop
4. How Doug Engelbart Pulled off the Mother of All Demos
5. Kay, A. (1987). Doing with Images Makes Symbols
6. Schematic for the arrangement and storage of stone blocks. Source
7. Sutherland, I. (1963). Sketchpad: A man machine graphical communication system