A figure-ground diagram is a mapping technique used to illustrate the relationship between built and unbuilt space in cities. Land coverage of buildings is visualized as solid mass (figure), while public spaces formed by streets, parks and plazas are represented as voids (ground). In urban planning, this simple yet powerful graphic tool is used to explore built form patterns and the continuity of open space.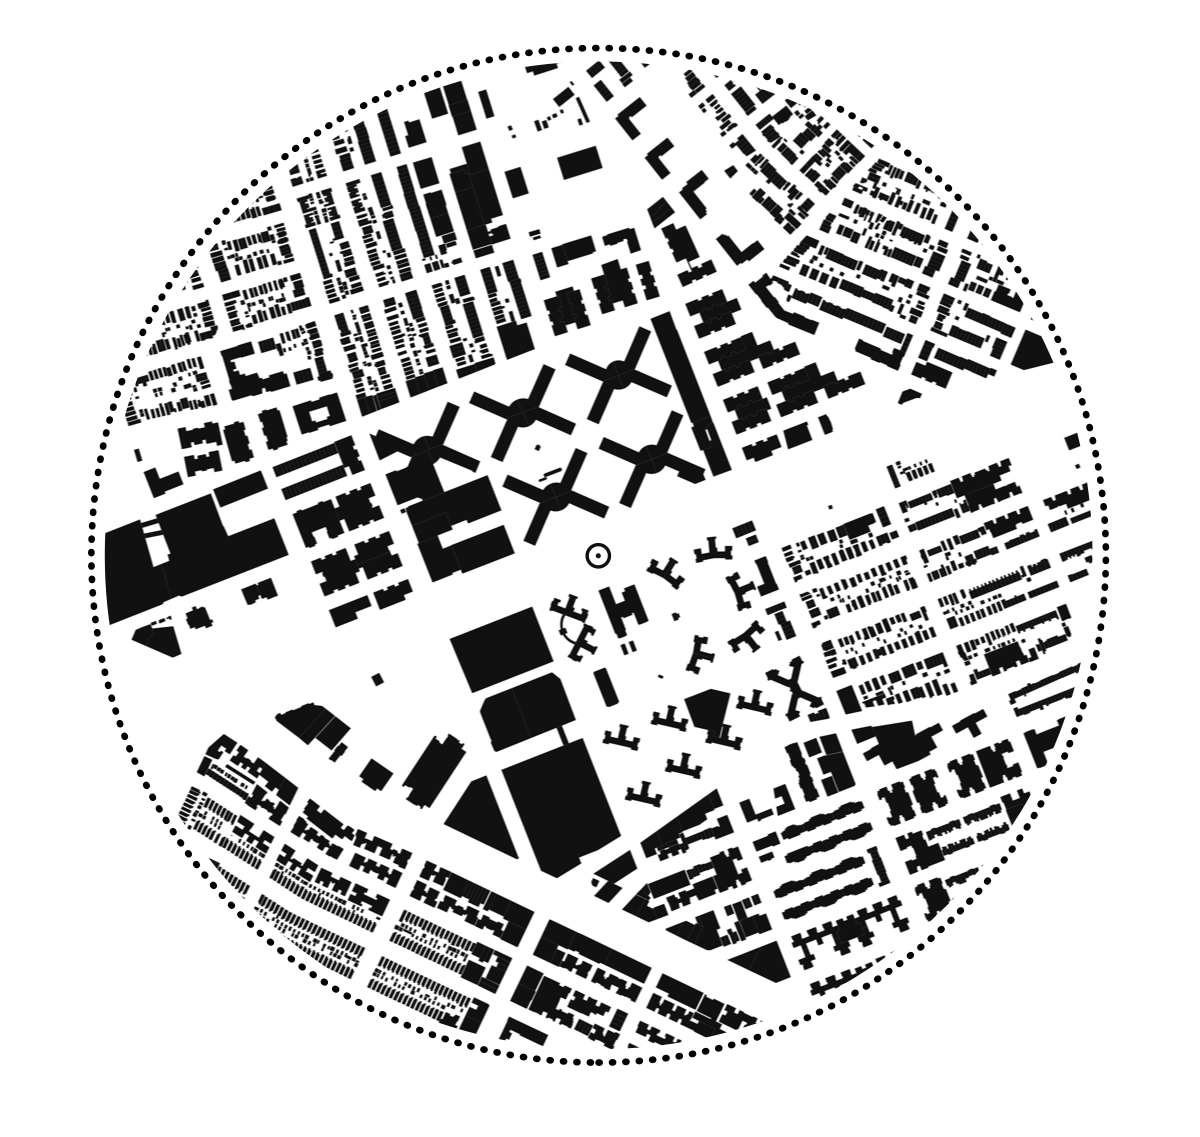 The solid black infill used for buildings in the figure-ground diagram is known as “poché” – a term originating from the École des Beaux-Arts in Paris. It was commonly used to describe the same graphic approach applied to architectural plans and sections. In the figure-ground diagram, the poché becomes a tool for studying urban morphology. This technique is great for illustrating solid-void relationships and the interplay between public and private space in urban settings.
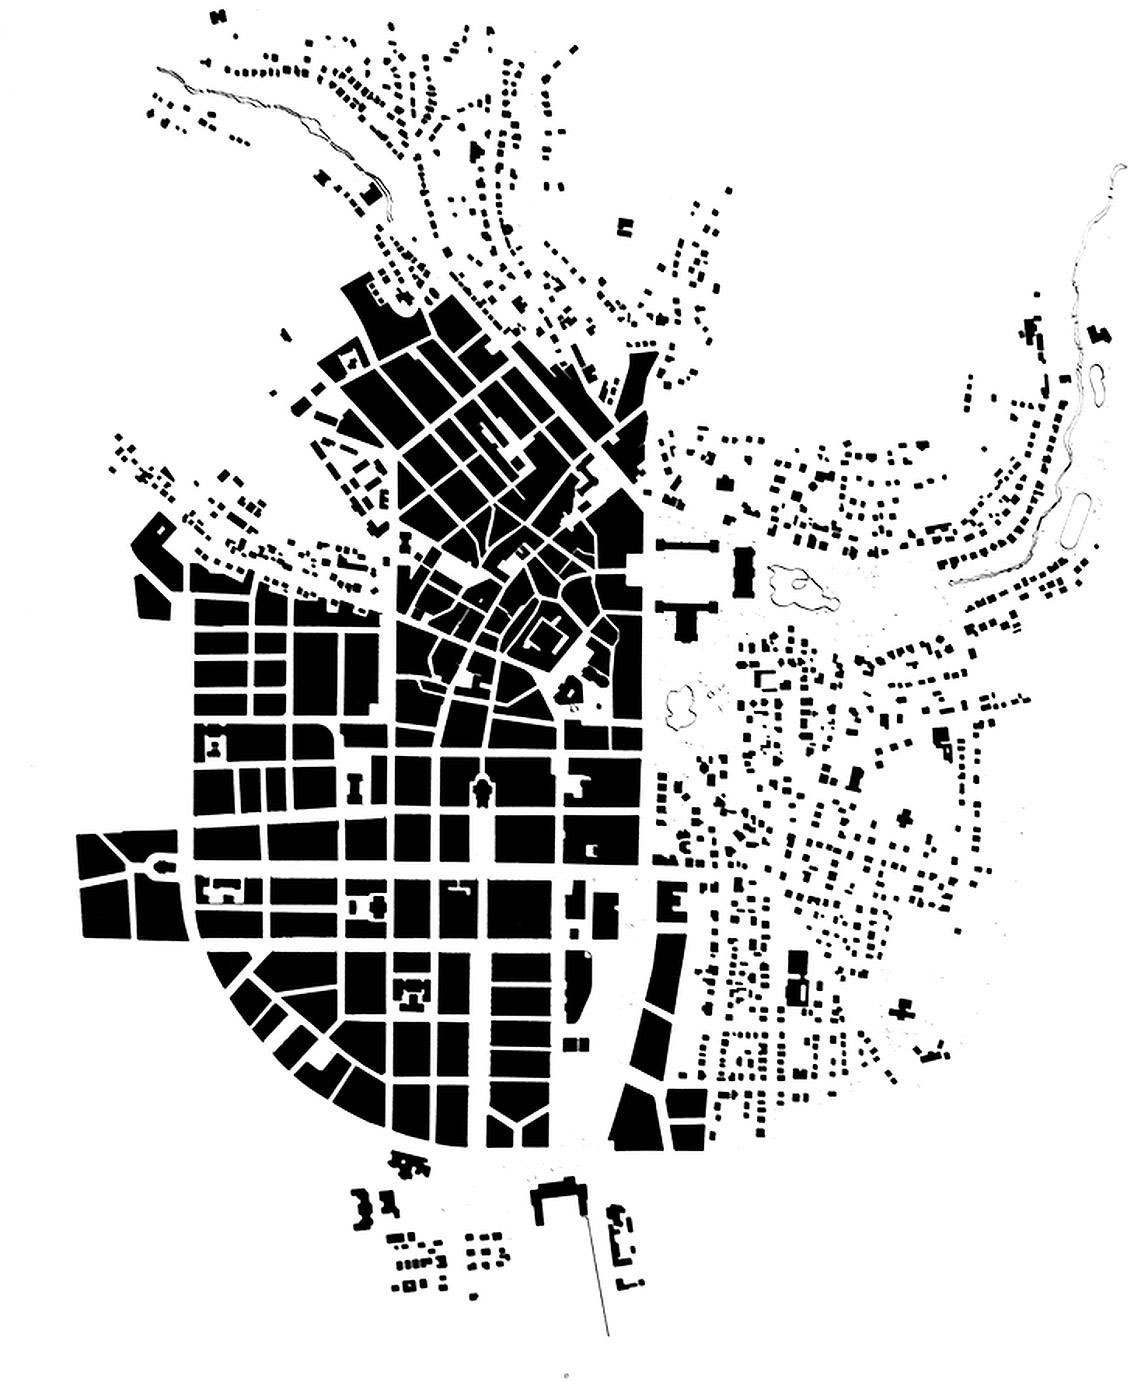
The Nolli map
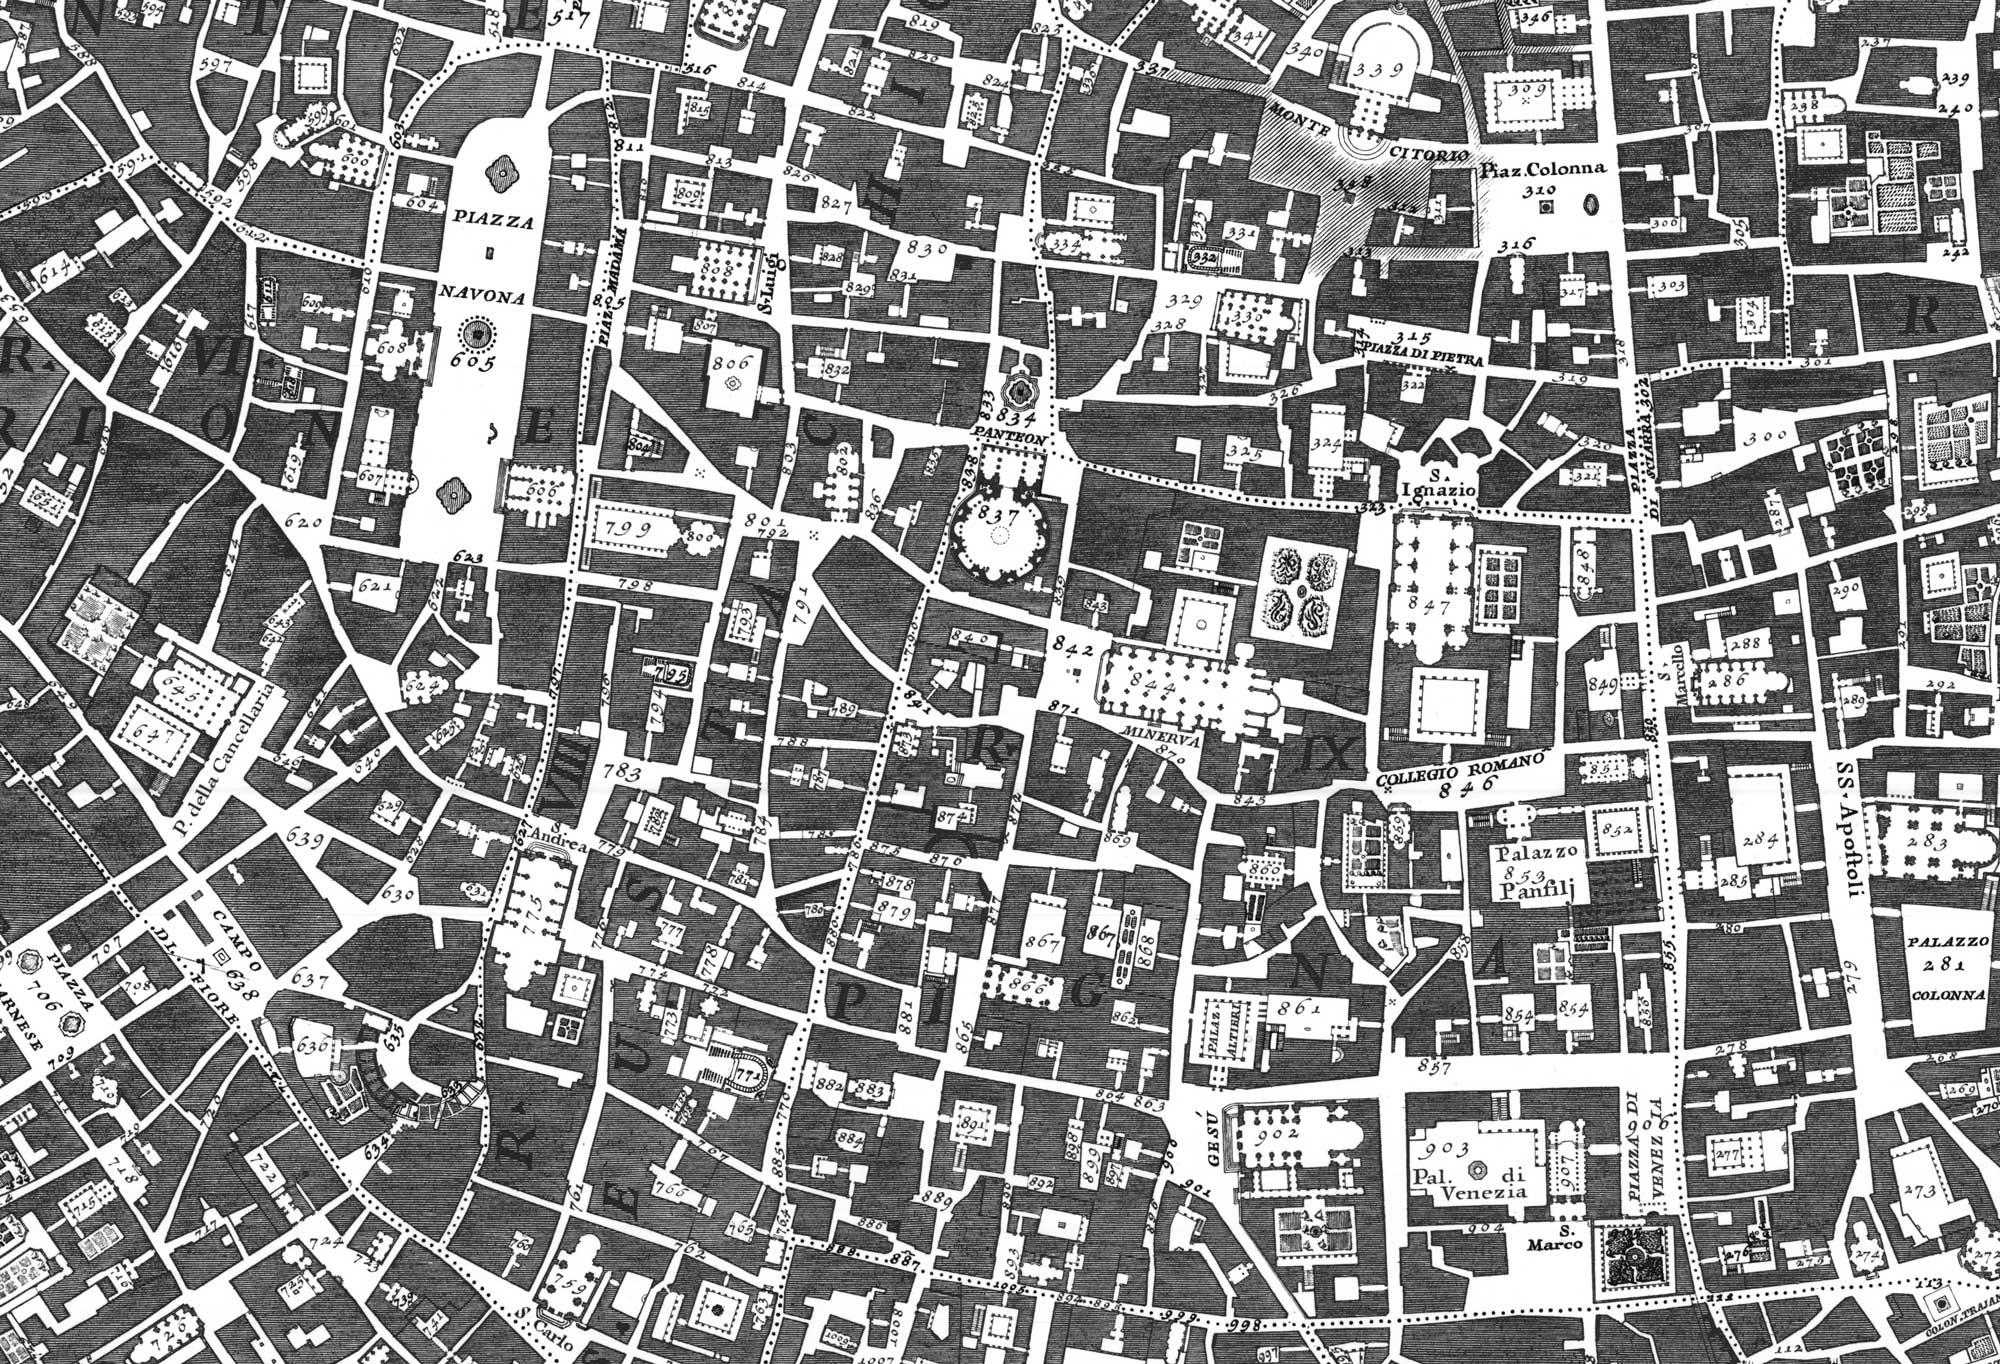
“Nolli’s map of the mid-eighteenth century reveals the sensitive and complex connections between public and private space in Rome. Private buildings are shown in gray crosshatching that is carved into by the public spaces, exterior and interior. These spaces, open or roofed are shown in minute detail through darker poché. Interiors of churches read like piazzas and courtyards of palaces, yet a variety of qualities and scales is articulated.” — Robert Venturi
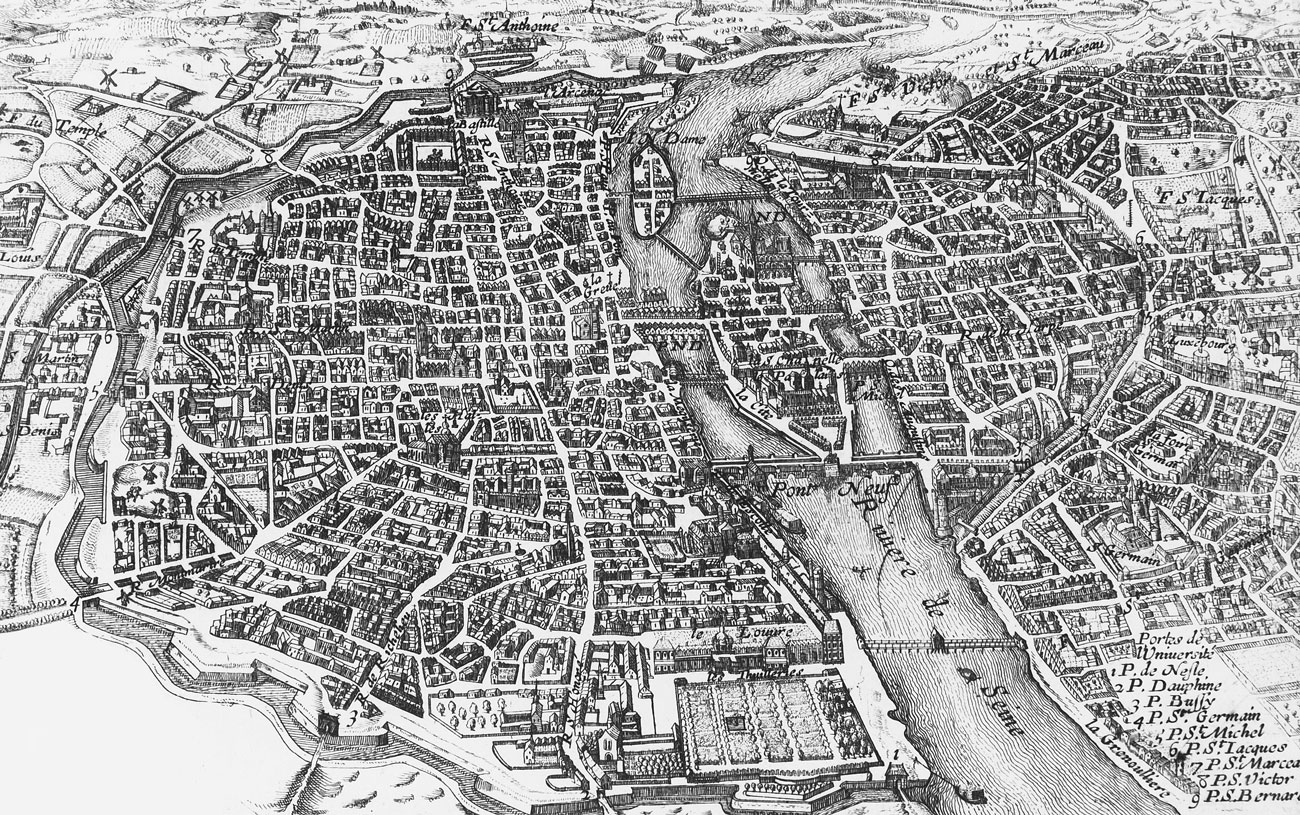
One of the best-known examples of a figure-ground map is Giambattista Nolli’s 1748 “Pianta Grande di Roma”. During that time, cities were usually portrayed with pictorial maps. With a focus on artistry rather than accuracy, pictorial maps provided a detailed bird’s-eye-view of the city that would highlight landmark buildings and places of interest. As beautiful as they were, these maps were of little use for wayfinding and urban management.
Nolli chose a different cartographic approach for his seminal work – an ichnographic representation of the city – and provided an extremely accurate orthogonal view of Rome.
“Ichnographic survey became standard in military maps but proved equally valuable for civil purposes such as municipal administration, cadastral registration and the wayfinding requirements of pilgrims and tourists.” — Michael Hebbert
La Pianta Grande is a milestone in urban cartography. It allows the viewer to explore the intricate build patterns of eighteenth-century Rome, as well as the system of open spaces that a pedestrian would experience while moving through the city. Nolli’s map features ground-level plans of over 2000 buildings — beeing publicly accessible they are part of the system of voids.
Up until the 1970s, the plan provided a base for other maps of the city. It is still one of the best sources of information for studying the historical core of Rome.
From Rome to Las Vegas
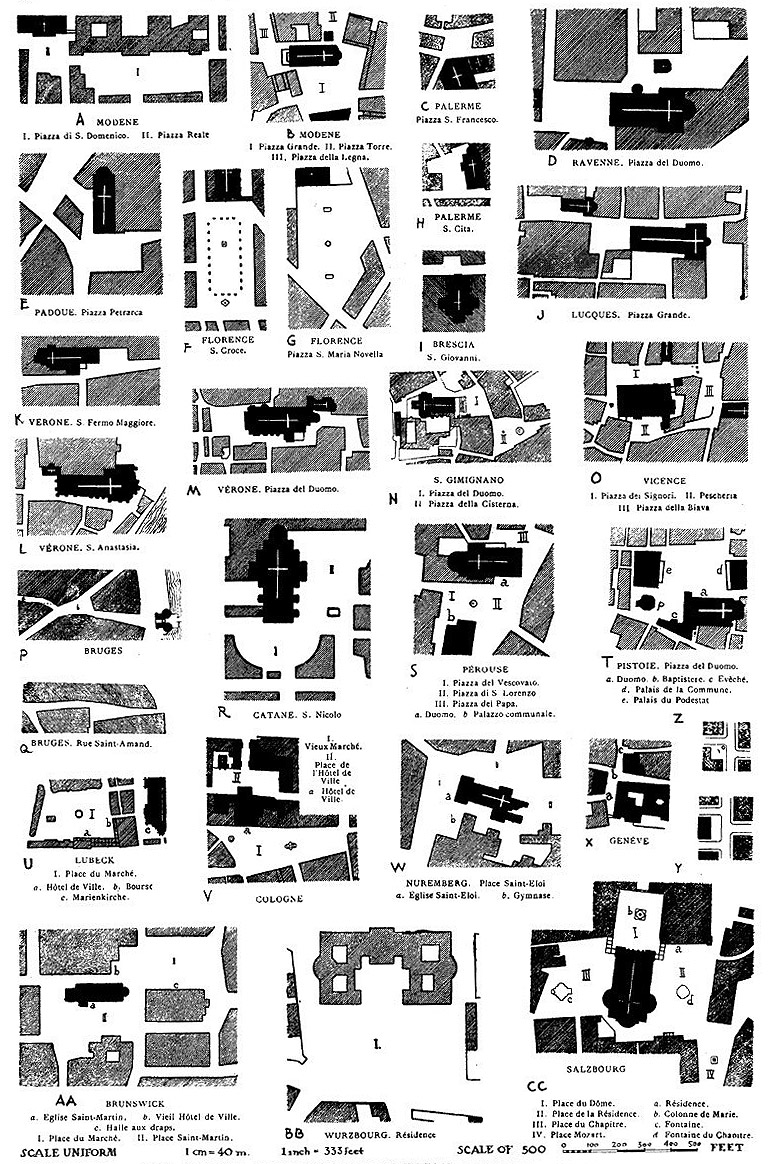
At the turn of the XXth century, the figure-ground diagram was still a tool for illustrating the intricacies of urban space. Camillo Sitte, who studied public spaces across Europe, used poché in his numerous sketches.
His book The art of building cities contains dozens of urban morphology studies, all illustrating public space in a solid-void manner. Later on – in the 1960’s – as many scholars were obsessed with the notion of place, his work regained popularity along with the figure-ground mapping technique.
Meanwhile, the modernist movement made little use of the figure-ground.
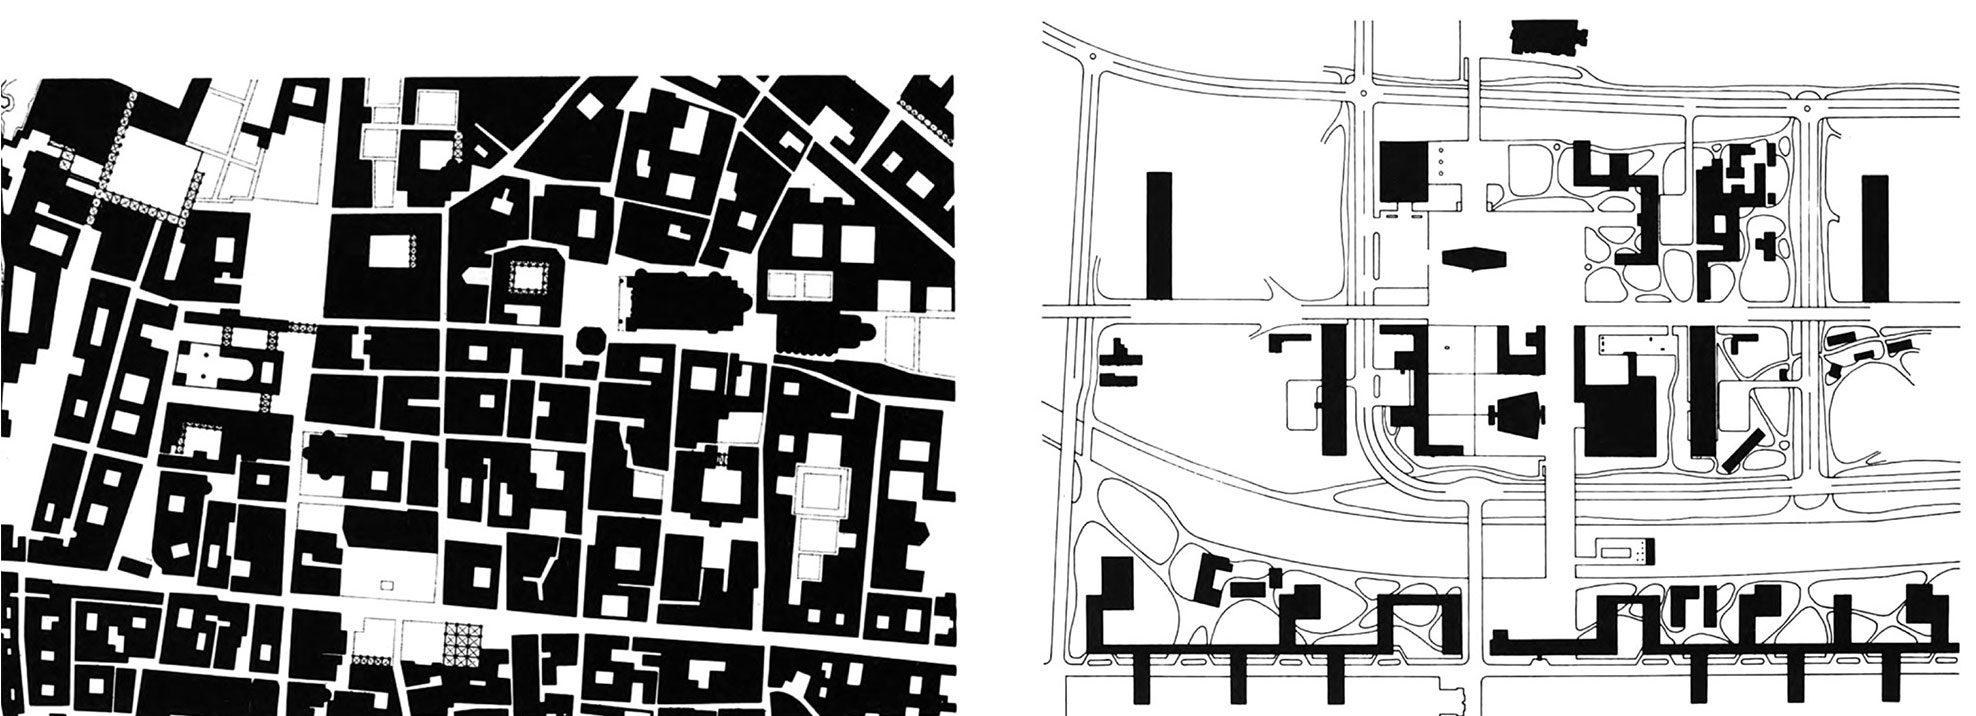
“The one is almost all white, the other almost all black; the one an accumulation of solids in largely unmanipulated void, the other an accumulation of voids in largely unmanipulated solid; and, in both cases, the fundamental ground promotes an entirely different category of figure – in the one object, in the other space.” — Colin Rowe
Modernism deemed the heavy poché of the traditional city as unhealthy and outdated. Instead, it promoted order and regulation. The desire to bring lightness back to the congested urban core took the shape of a Ville Radieuse – a place where skyscrapers and vast stretches of greenery would provide a healthy lifestyle.
As modernist masterplans produced objects rather than spaces, the figure-ground became a rather uncommon mapping tool. In his study dedicated to the history of this mapping technique, Michael Hebbert explains that it rarely appeared in the reconstruction plans of the 1940s and remained absent even when second-generation Modernists began to rediscover ‘the heart of the city’ and ‘townscape’ in the 1950s.
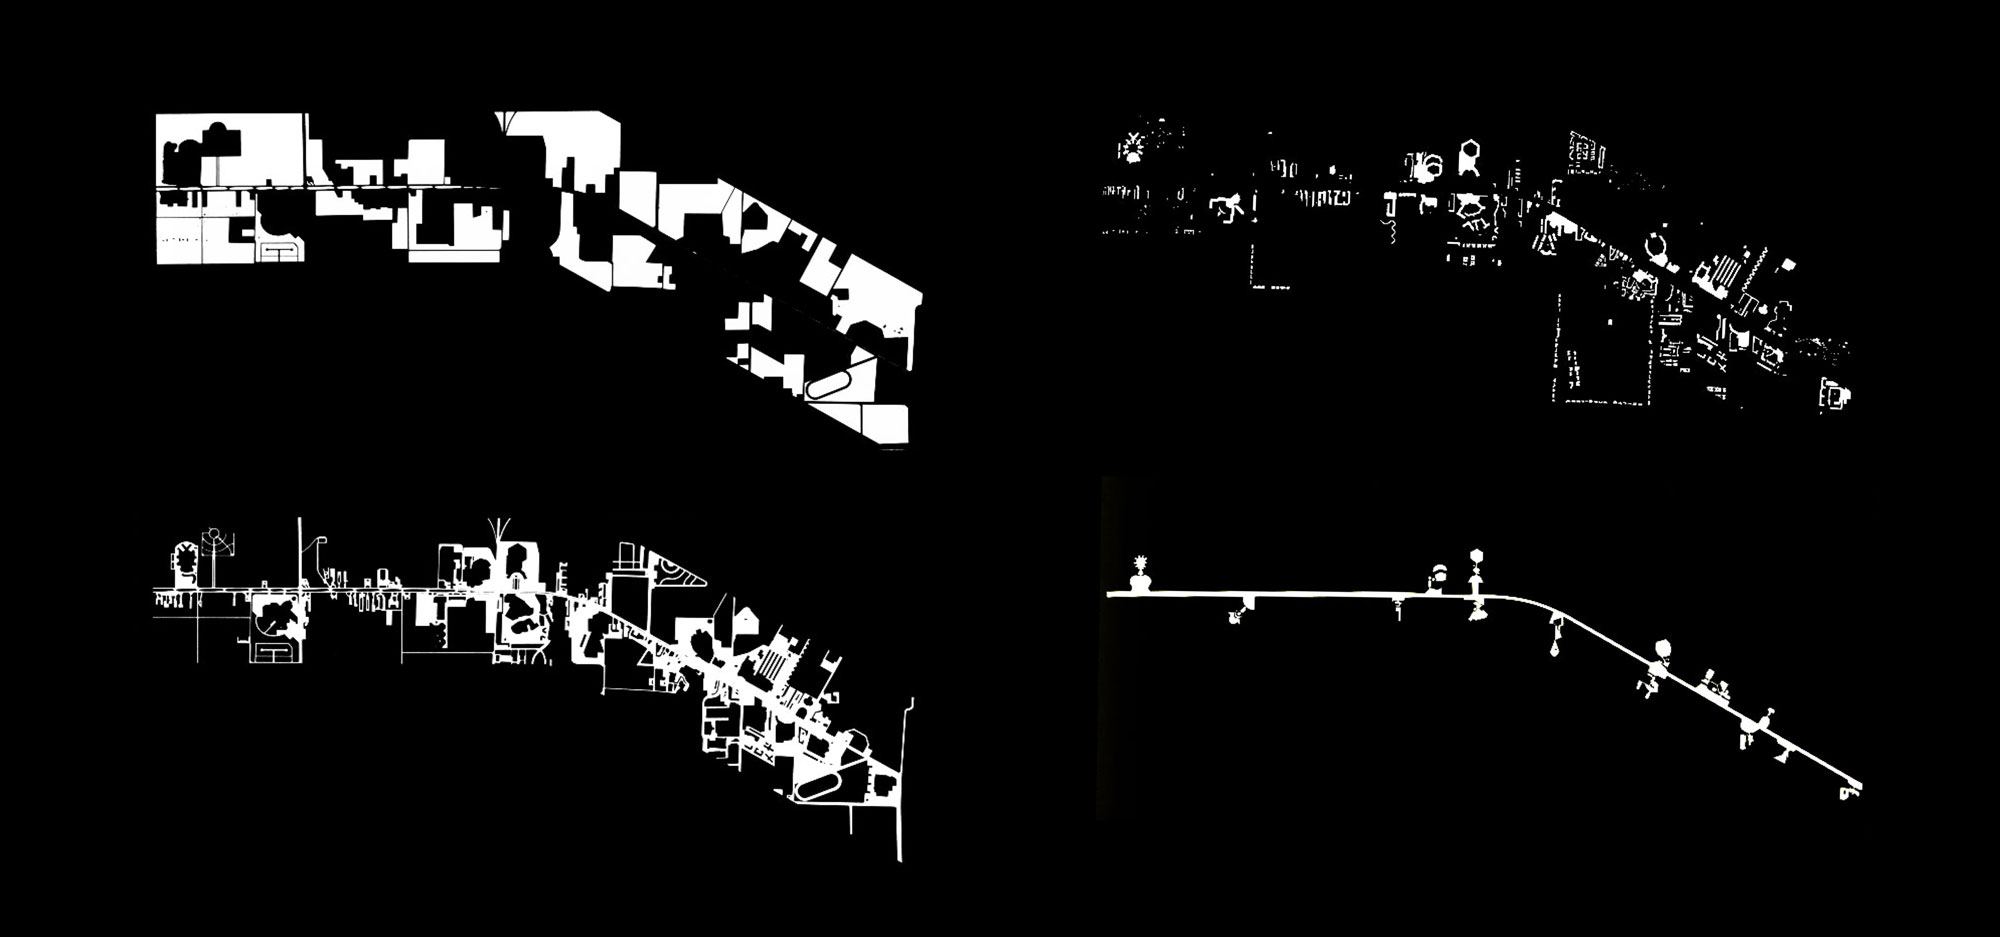
“Las Vegas is to the Strip what Rome is to the Piazza.”
— Learning from Las Vegas
By the end of the 1960s, the disillusionment with modernism reached a critical point. The desire for total planning was replaced by a nostalgic view of the past and a renewed interest in the vernacular. Avid discussions around the notion of place gave rise to Contextualism.
The post-modern conditions had an impact on architectural education as well. While practitioners and scholars were rethinking the image of the city, they began searching for new analytical methods and graphic tools. The figure-ground diagram became the perfect pedagogical tool to address the collision between the object-oriented modernist architecture and the historic city.
Colin Rowe played an important role in the revival of the figure-ground along with Venturi, who was highly influenced by his trips to Rome. At Yale, Robert Venturi, Denise Scott Brown and Steven Izenour, taught a studio course called “Learning from Las Vegas, or Form Analysis as Design Research“.
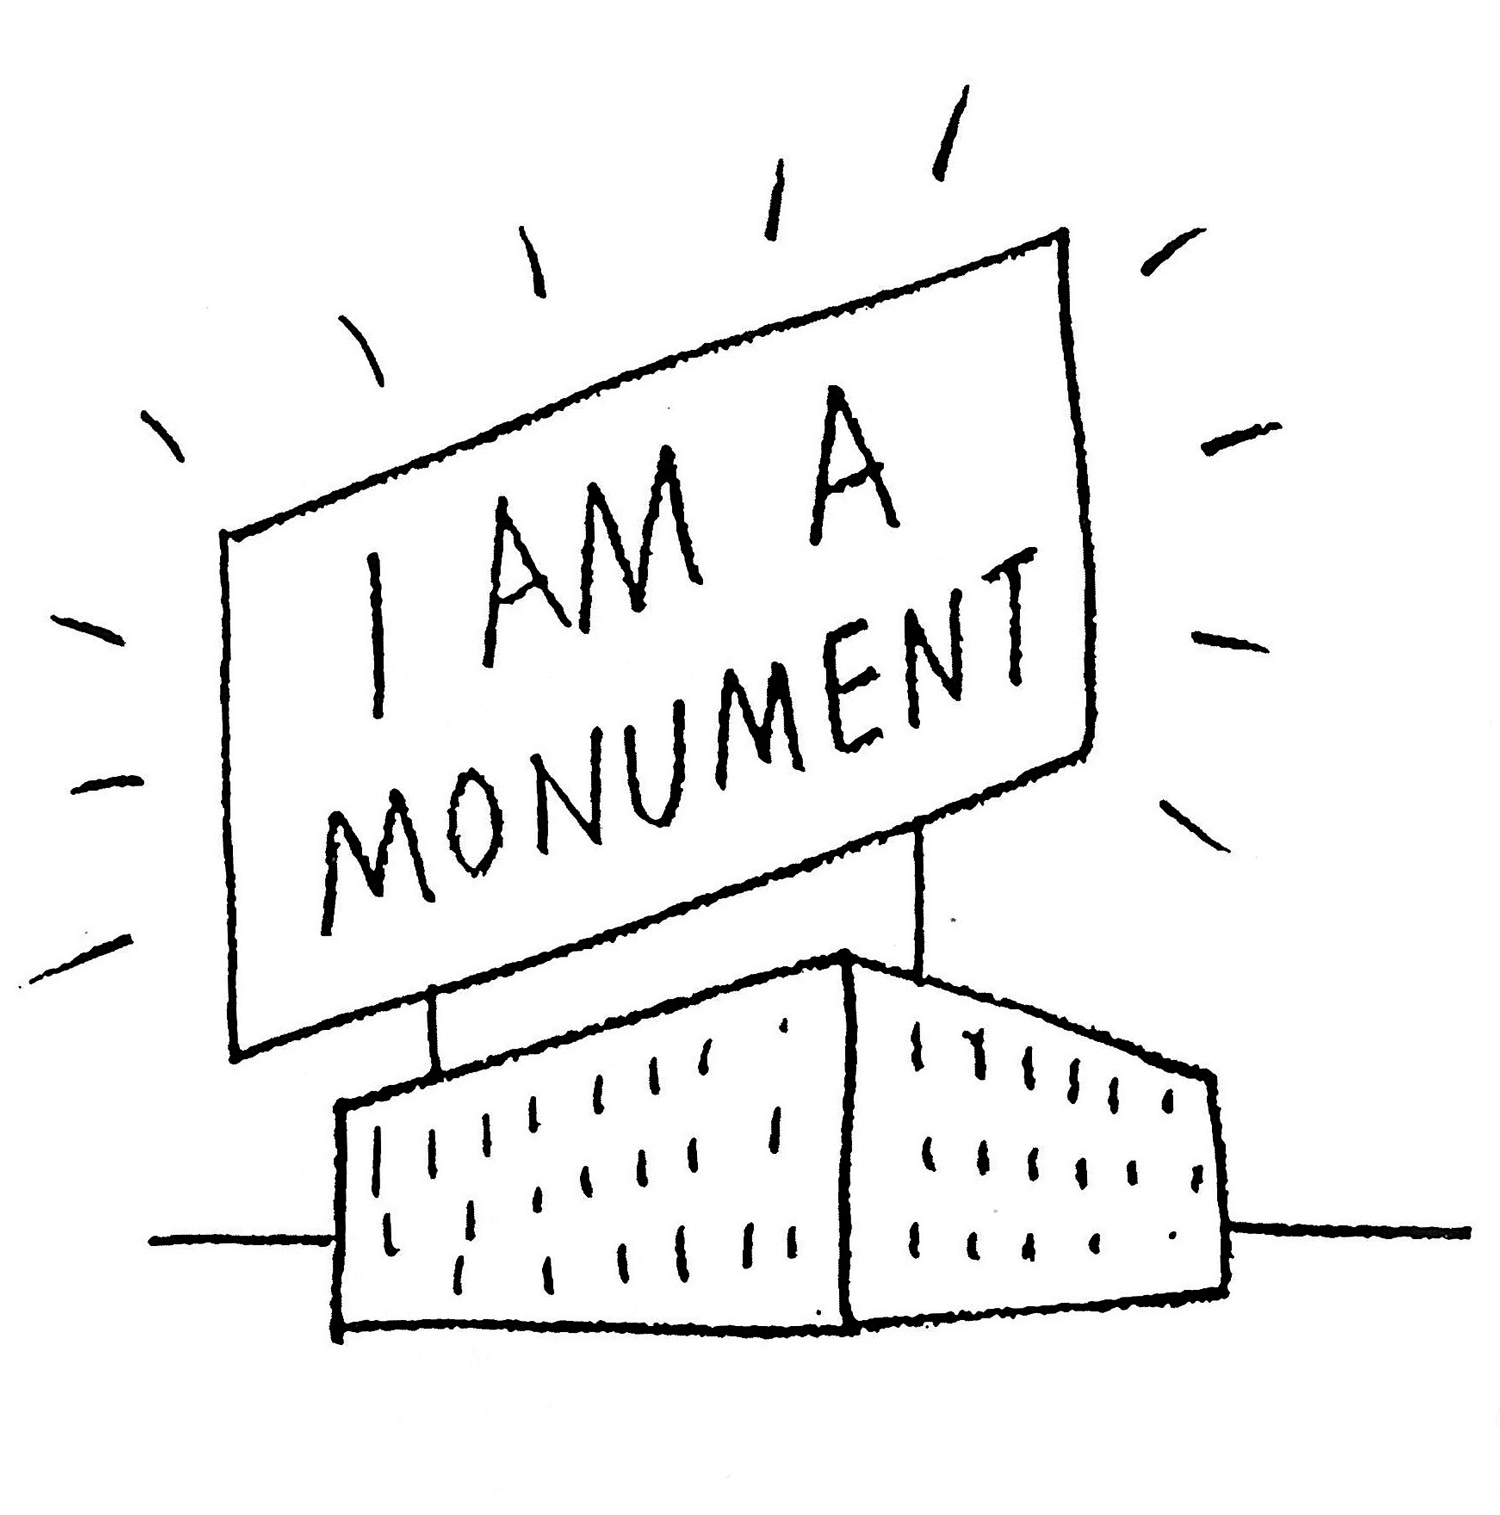
“Our hope is to produce graphic and other visual techniques as suited to the neon processional of Las Vegas as were Nolli’s maps to the baroque of 18th century Rome.” — Studio LLV
The goal of the course was to investigate the archetype of the commercial strip through careful documentation and analysis of its physical form. Part of the laborious fieldwork resulted in the creation of a “Nolli” map of the Las Vegas Strip. This collaborative research later gave form to one of the most influential and controversial architectural books of the XXth century.
The solid-void abstraction is also part of the vocabulary and graphic tradition of Cornell’s Urban Design Studio. Directed by Colin Rowe from 1963 until 1990, the studio played an important role in the evolution of three theories – Contextualism, Collision City and Collage City.
“These drawings derive from the principles of gestalt psychology. They polarize space and mass, alternatively emphasizing the shape of each, drawing attention to reciprocity and, at an urban scale, the structural relations of figure, field, texture, pattern, edge, axis and so on.” — Cornell Journal of Architecture, vol. 2
Rowe saw the city as a whole that is more than the sum of its parts, a gestalt. His holistic approach to urban design set the figure-ground as a primary investigation tool in the studio. Among the various formal and conceptual strategies taught in the course, the figure-ground was the most effective way to reconcile the lessons of history, offered by the traditional city and the modernist approach to planning.
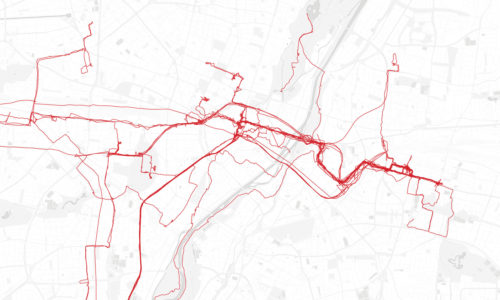
The figure-ground layer of Morphocode Explorer
The figure-ground as a tool for urban analysis
The figure-ground diagram is an important element of urban analysis. It is a great way to study the grain of development and the overall morphology of the city. The technique is particularly useful for observing the relationship between open space and built form. Is is easy to interpret and is valued for its simplicity.
Along with its strong visual qualities, the figure-ground has certain limitations. It omits all information beyond the two-dimensional space like topography and building height. The study of morphology and built form is a single aspect of urban analysis. Information on zoning and land use, ownership, economic vitality, mobility and demographic patterns provide a deeper understanding of the city.
In the last year, we’ve been designing an interactive web tool for urban analysis, that will provide access to various urban metrics and map layers, including a figure-ground map. Morphocode Explorer combines multiple data sources in a single, powerful, easy to use interface for exploring the city. You can subscribe in the form below to get notified on further updates.

Join the beta!
Readings:
1. Copper, W. (1982). The figure/grounds. Cornell Journal of Architecture, 2, 42–53.
2. Hebbert, M. (2016). Figure-ground: History and practice of a planning technique. Town Planning Review, 87, 705-728.
3. Lucan, J. (2005). Généalogie du poché: De l’espace au vide. Matiéres, 7, 41–54.
4. Koetter, F., Rowe, C. (1978). Collage City. Boston: MIT Press.
5. Trancik, R. (1986). Finding Lost Space. Van Nostrand: New York
6. Venturi, R. (1972). Learning from Las Vegas. Cambridge, MA: MIT Press.
7. Verstegen, I. and Ceen, A. eds. (2013). Giambattista Nolli and Rome: Mappingthe City before and after the Pianta Grande, Rome, Studium Urbis Rome CenterArchitecture and Urban Planning in Italy.
8. Wortham-Galvin, B.D. (2010). The Woof and the Warp of Architecture: The Figure-Ground in Urban Design. Drawing Theory, Autumn 2010, pp. 59-74

Mapping Urban Data
We have launched our first video course Mapping Urban Data. It contains 30 carefully organized and beautifully illustrated videos that will lay a solid foundation for your mapping skills.
Learn More