Here are some of the most interesting resources that we’ve shared recently on facebook, twitter and google+.
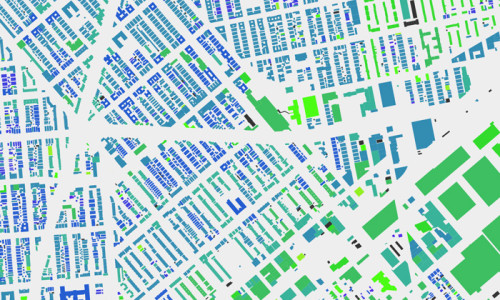
This is how we move
Human data shows how we move in cities. Walking, running, cycling and motorized transportation data tell us different stories.
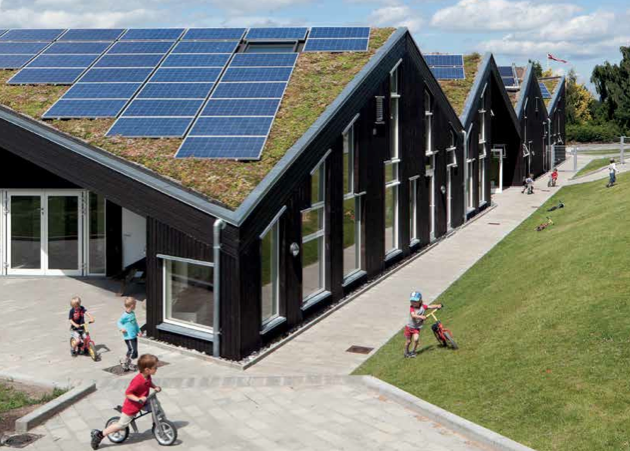
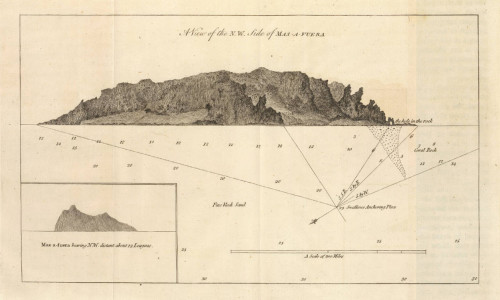
Dannish Architectural Policy
“Good architecture provides a secure, functional environment for our fulfillment, both as individuals and collectively. The Danish government therefore wishes to give all, especially children and young people, access to experiencing the architecture’s creative world and gain insight into how architecture affects us as human beings.”
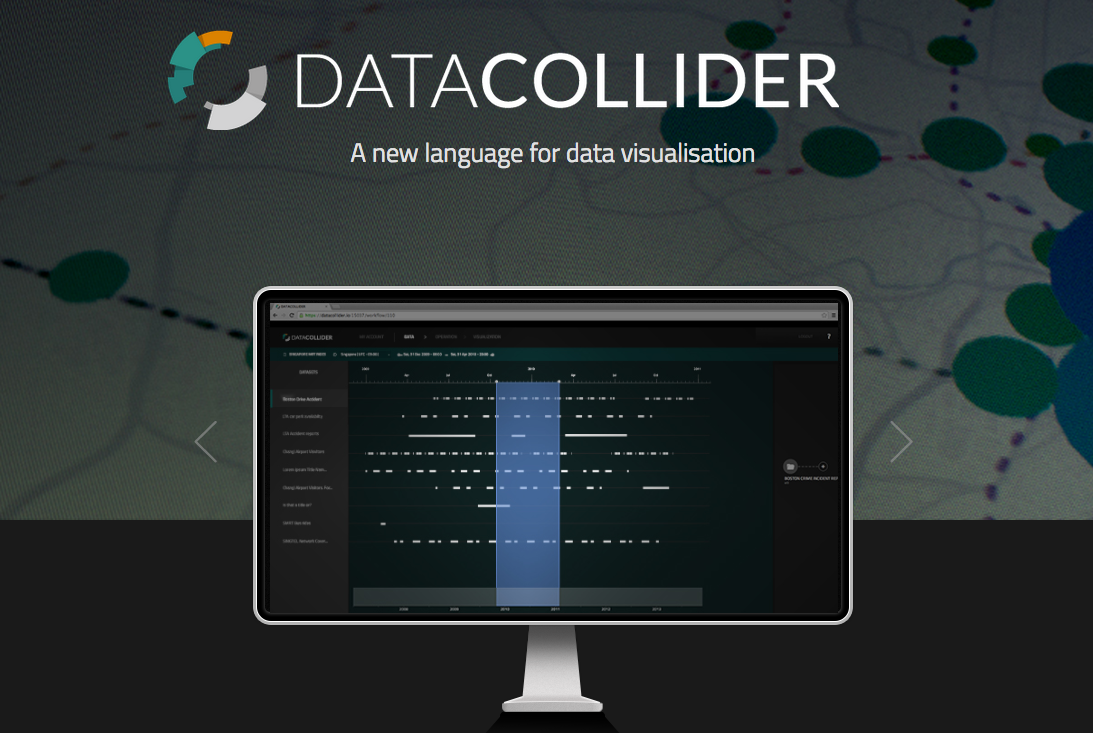
Data Collider
Data Collider is a new web platform to “create next generation visualisations in a fast and easy way”. The project was created by a team at MIT Senseable City Lab and is currently in beta.
Visualizing Algorithms
A great presentation by the creator of d3.js – Mike Bostock about how algorithms work: their logical rules and behavior.
Isoscope – Exploring Mobility
An interactive tool that creates aesthetic visuals about locations that are reachable by car in a chosen time from a chosen location.

“It is more exciting to be designing conditions for events than to be conditioning designs.”
Bernard Tschumi
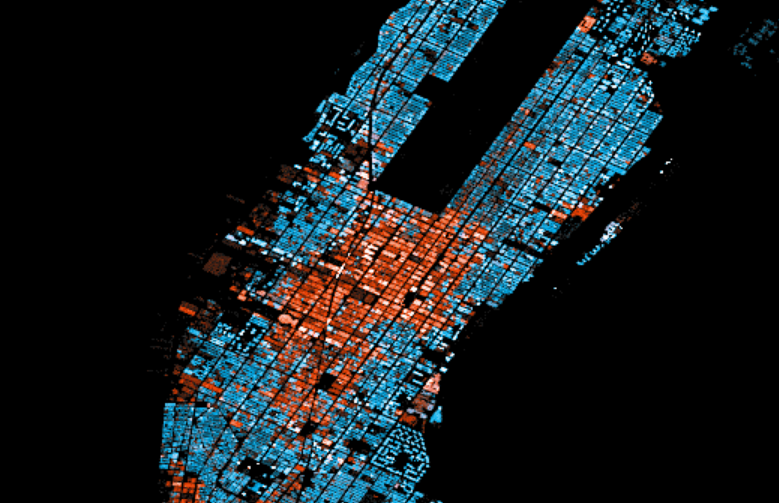
Breathing City
An animated map that visualizes the cliché of New York as the “city that never sleeps.” The map displays a 24-hour cycle of Manhattan’s populations at work and home.

Manipulated Landscapes by Witchoria
Artist Victoria Siemer aka Witchoria transforms landscapes by adding an element of the geometric into natural surroundings.