This week’s picks contain a mix of design style guides, map making tutorials and machine learning research.
The list includes design manuals from USGS, tutorials on automating data processing and research on applying neural networks to architectural design.
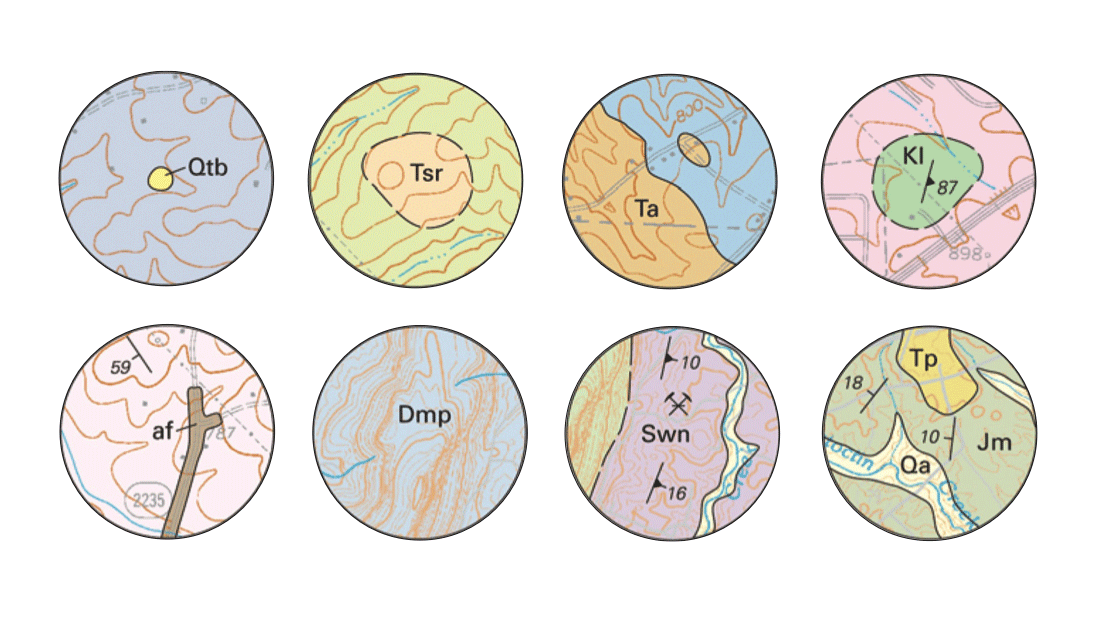
Mapping style guides
The US Geological Survey develops various high-quality topographic and geologic maps. Recently, Ben Welsh filed a request with the Agency for any design style guides covering mapping and data visualization.
The Agency responded by providing their Illustration standards – a comprehensive set of tools for effective graphic communication. The document contains advice on color palettes, visual variables, graphs and diagrams, cartographic best practices and other useful design resources.
You can download the Illustration standards PDF here (59MB). Check out the Github repository for all design resources provided by USGS.

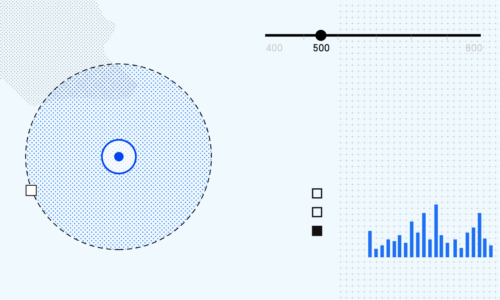
Creating a beautiful world map using open source data & software
Fabian Ehmel and Boris Müller published an interesting case study of designing and building a custom map of the world using open data and free web technologies.
The map is based on the “Waterman Butterfly” projection which preserves the overall shape of the continents. The cartographic design is influenced by the classic Swiss topo maps and makes great use of typography.
The map rendering was done using d3, d3-geo and node-canvas. You can check out the source code and learn more about the mapping workflow on the project page.
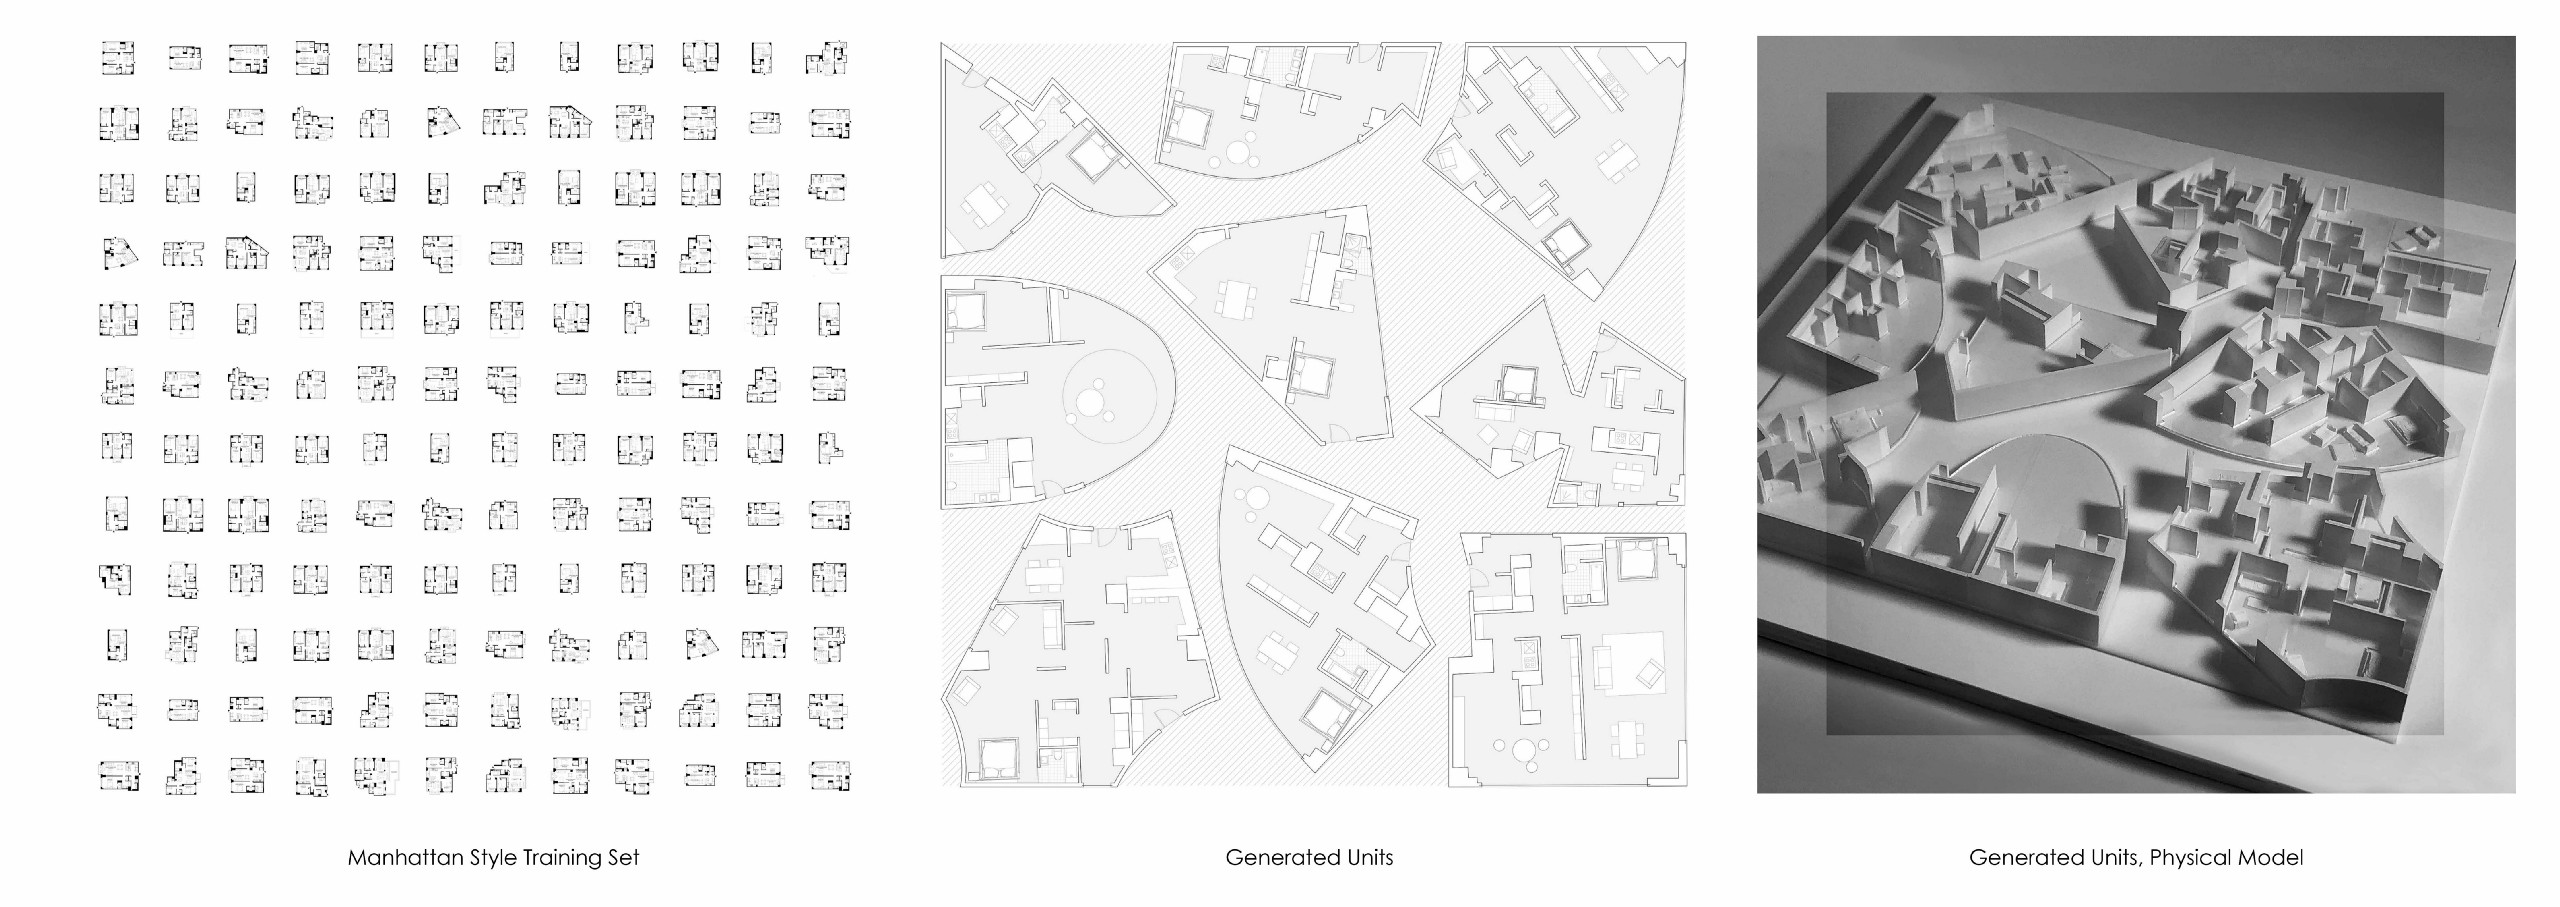
Using machine learning to design floor plans in different architectural styles
Generative adversarial networks(GANs) are able to generate “fake” images from a set of input photographs. Nvidia demonstrated how this technique can generate high-quality images of human faces, vehicles, rooms and other objects.
The application of GANs is not limited to image synthesis. This type of neural networks can be used to create 3d worlds, video and character animation.
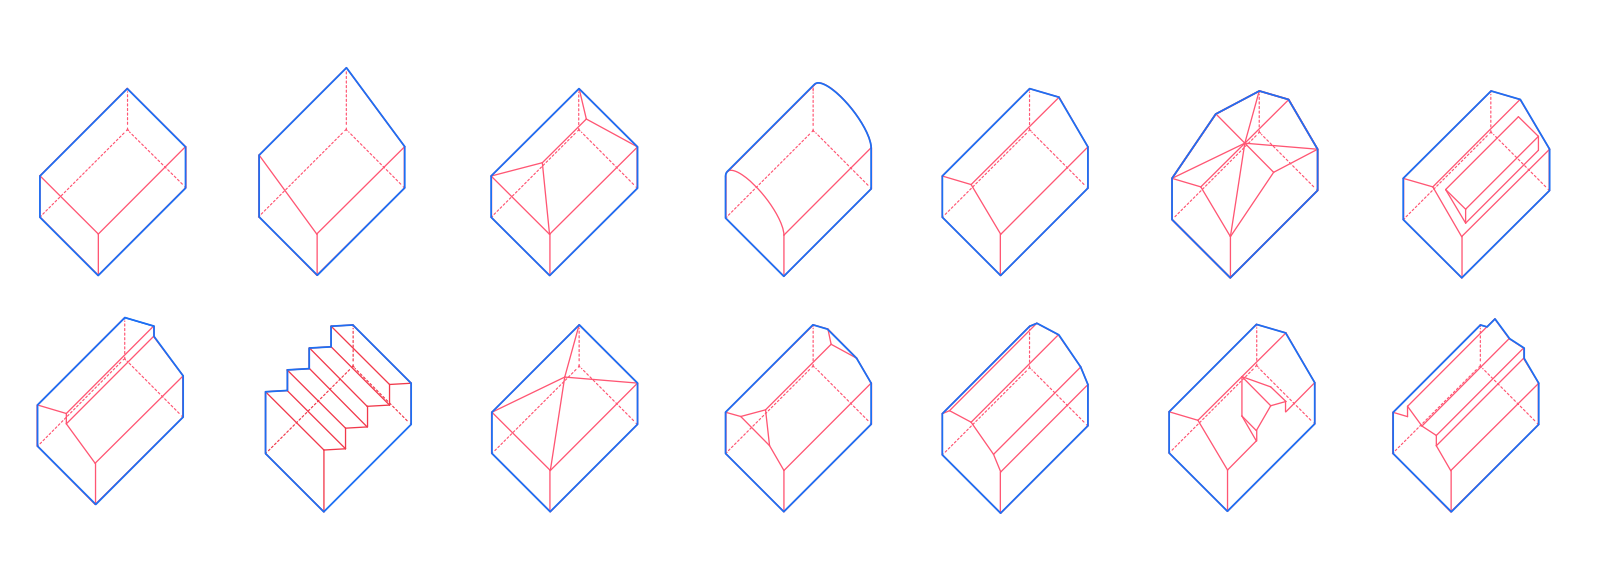
In a recent publication, Stanislas Chaillou shared his research on using GANs to design architectural floor plans. He trained the Neural network using floor plans designed in various architectural styles. The resulting apartment units have different spatial layouts representative of each style.
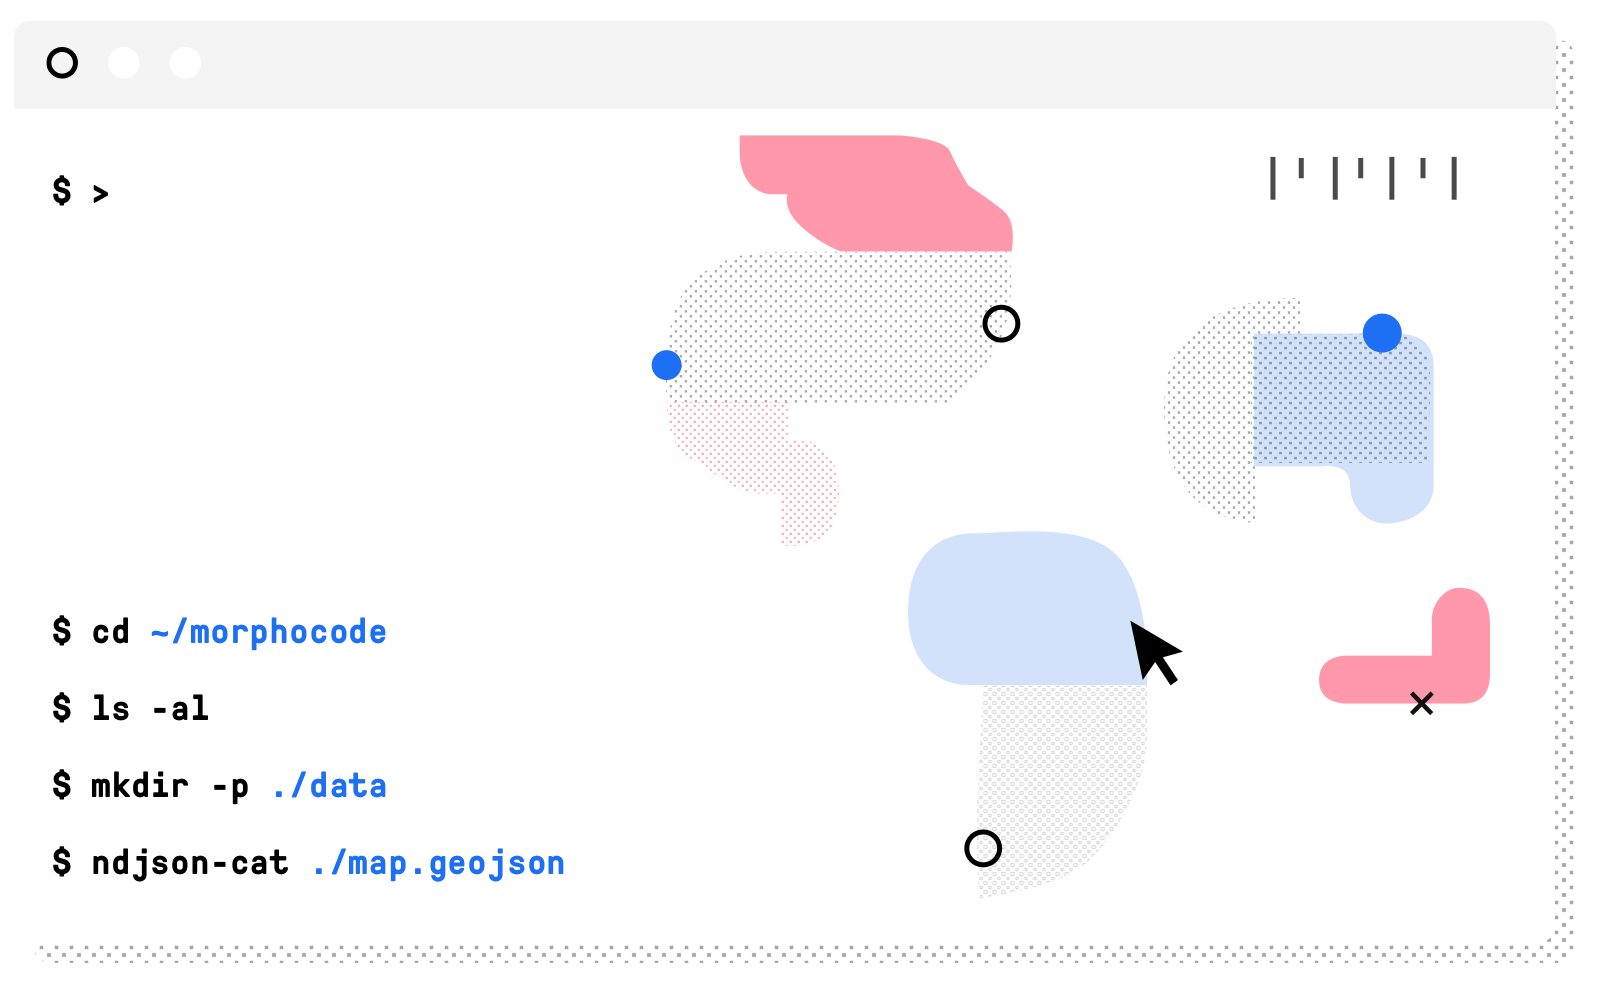
Command-line cartography
The “Command Carto” guides by Dylan Moriarty are a great introduction to working with geospatial data on the command line. The tutorials are beautifully illustrated and are easy to follow.
The first tutorial in the series teaches you how how to use mapshaper to perform common operations such as reprojecting, clipping and data joins. The second guide covers how to use Make and makefiles to automate data processing tasks.
Mapmaking in the age of Artificial Intelligence
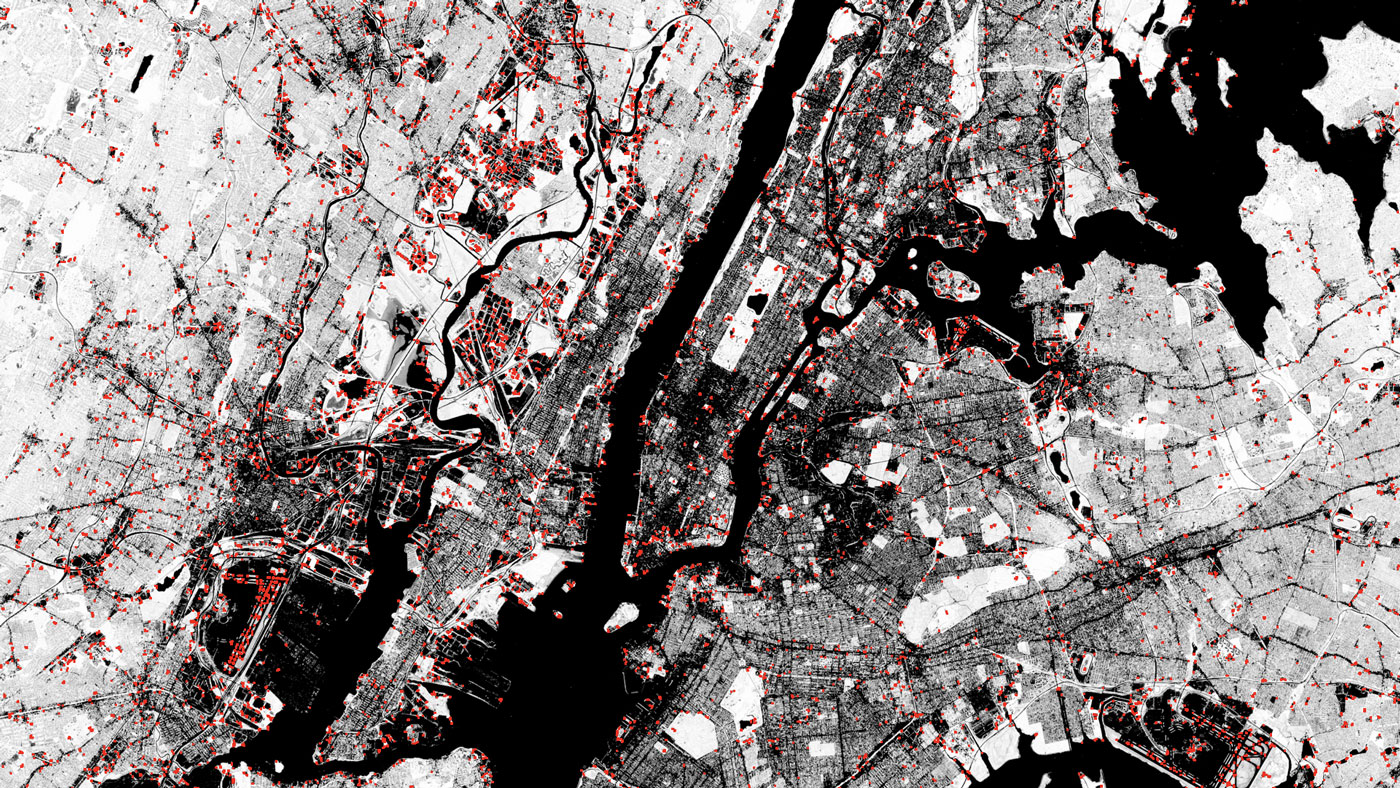
“Mapmaking in the age of artificial intelligence” by Tim Wallace highlights the increasing role of machine learning in cartography and remote sensing. The story contains beautiful imagery and illustrates some of the key differences between classical programming techniques and machine learning algorithms. It also discusses the mapmaker’s role in this data-driven process.
Regulating the Curb
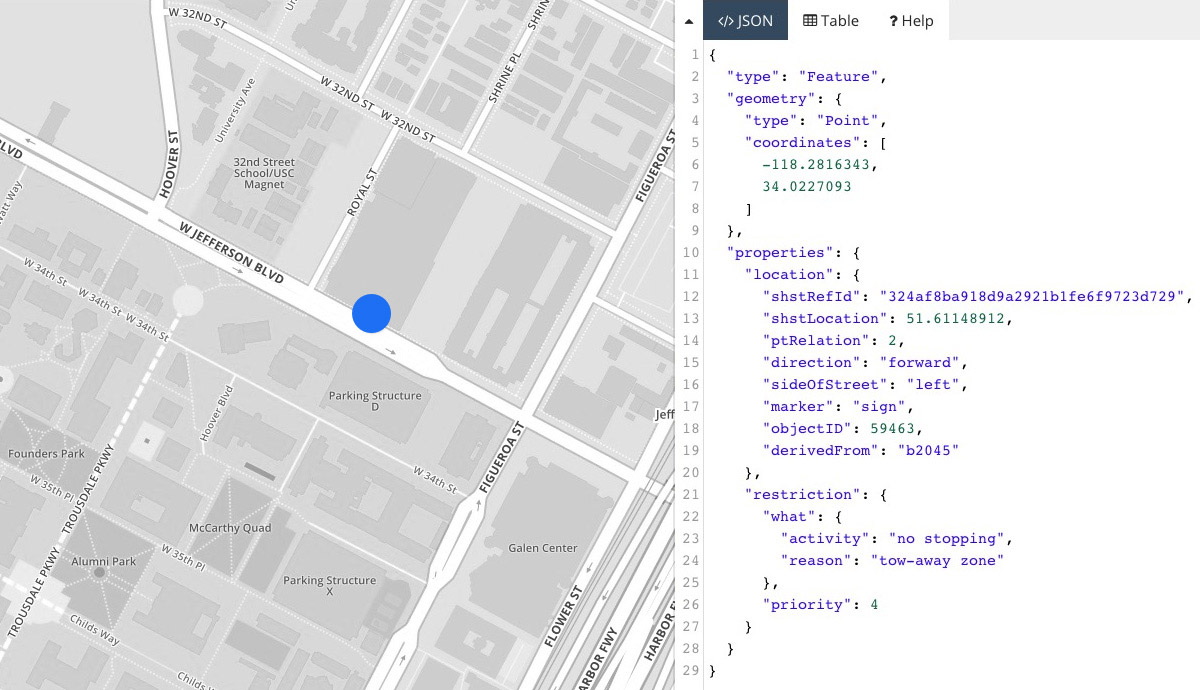
With the rise of new mobility services, cities face increasing pressure to better manage curb space. The first step in this process is to collect structured data about where curbspace exists and how it’s regulated.
SharedStreets published the first draft of CurbLR – an open standard for curb regulation. It is a JSON format that includes all regulations as a GeoJSON object. Each curb regulation is structured as a GeoJSON Feature with three components: the geometry (point or line), the location properties, and the restriction that applies.
![]()
Svelte
Modern web frameworks such as React and Vue are based on the idea of components – you build your application by combining different components together. To render these components on the page, you need to transform them into a set of DOM elements. Usually, the framework takes care of this transformation by using techniques like virtual DOM diffing. This is convenient, but comes at a price – the browser has to do extra work at runtime.
Svelte is a web framework that takes a different approach. Instead of doing the transformation at runtime (while the user interacts with the application), it compiles your components into efficient imperative code at build time.
The latest version of the framework has a built-in reactivity model, which makes it a good choice for interactive data visualizations and stories.
Dimensions Guide
Dimensions.Guide is an online catalog of drawings documenting the standard measurements and sizes of everyday objects. Each drawing is available to download in .dwg, .svg, and .jpg formats. This makes it a very useful resource for architects, designers and urbanists. The site contains various drawing collections – from people silhouettes and furniture to politicians and Marvel characters.