Location data meets great design
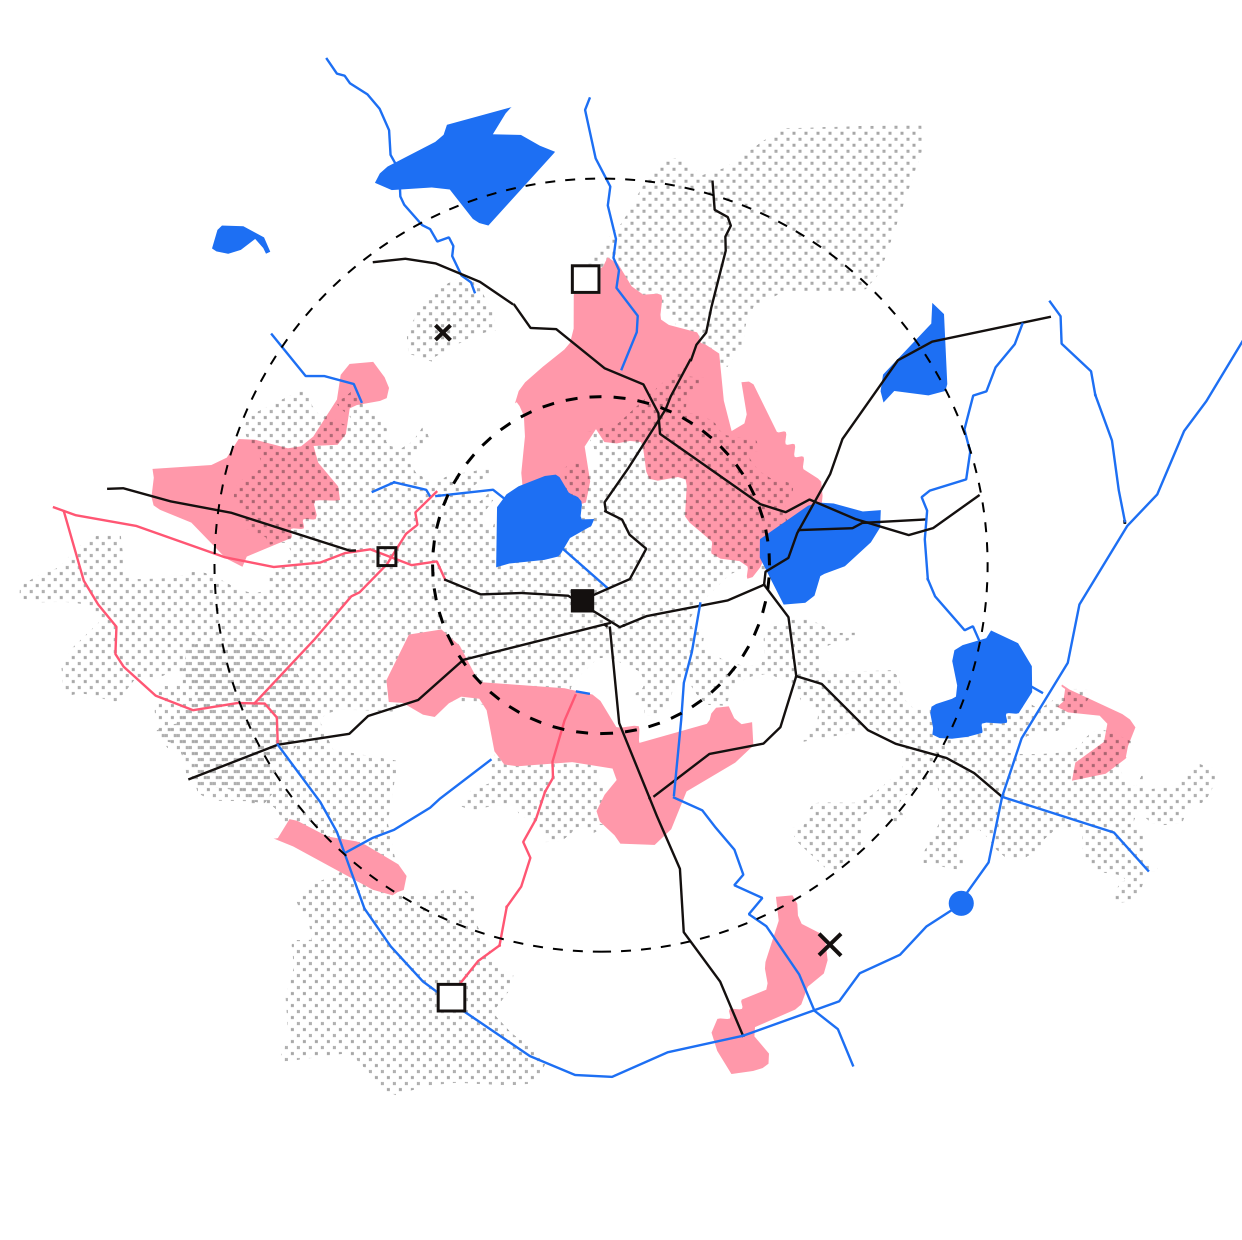
 

Understanding location data is about understanding cities. But it is also about interpretation and communication. When combined with an effective design strategy, data analysis reveals insights and allows for trends and patterns in the data to emerge.

At Morphocode, we bring together expertise from architecture, design, urban planning, and software development to visualize urban dynamics and provide location insights. Our work covers diverse topics: from exploring historical layers and cultural heritage to analyzing pedestrian activity, business performance, and air pollution.

Covering the whole process from design to development, we build data-driven dashboards, create beautiful interactive experiences, and make custom tools for data analysis and visualization.

What we do

Learn with Morphocode

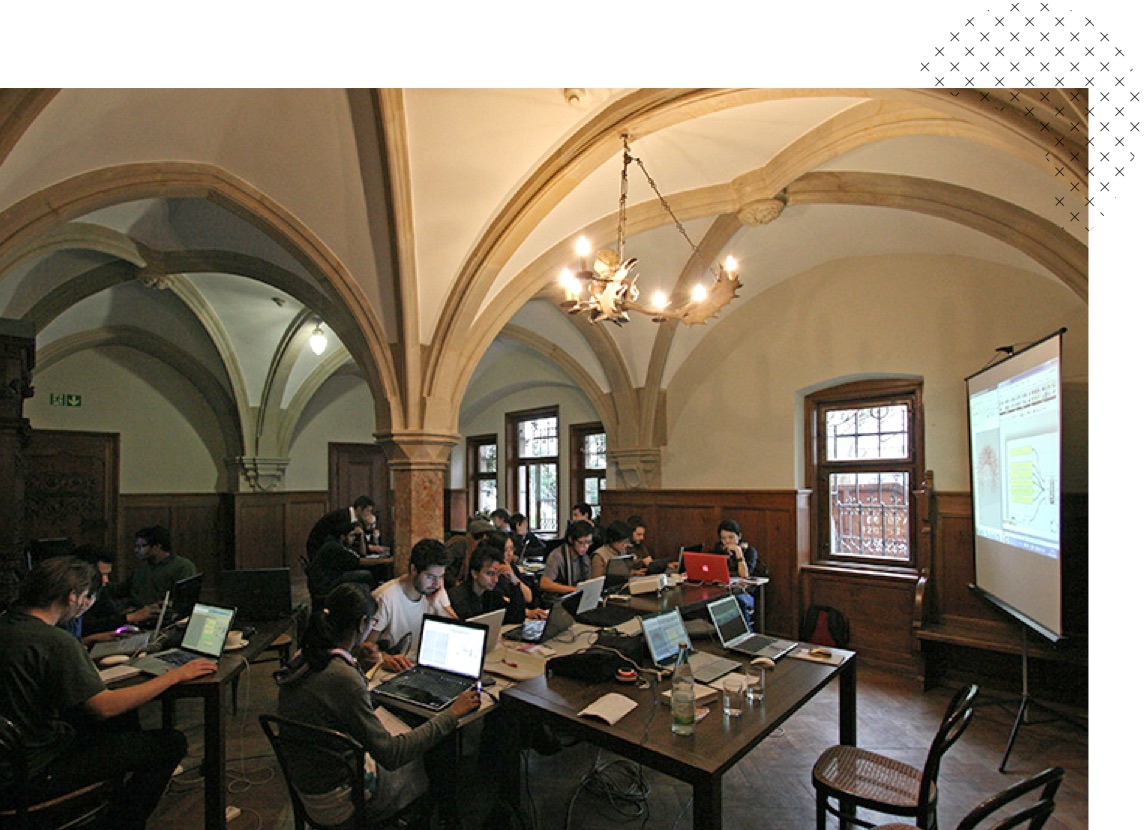
Our workshops teach students and professionals how to work with data, design better experiences, and use code as a creative tool. We’ve taught workshops in various schools such as the Staedelschule Architecture Class in Frankfurt and the Master Architettura Digitale Iuav in Venice.

We also provide online courses and tutorials on data visualization, creative coding, and urban data science. Check out Morphocode Academy to start learning at your own pace.

Start Learning
129k

More than 129k people
visited our projects

30

People from over 30 countries
are learning with our video courses

17k

17k+ subscribers to
our newsletter

Awards and recognition

Our project “Urban Layers” has been featured in the Best American infographics series and named among the top ten interactive data visualizations by Simon Rogers. 

In 2017 we were awarded the Mayor’s award for cultural contributions for our work on mapping the cultural heritage of Sofia.

Morphocode’s projects have been featured on CityLab, Engadget, Designboom, Yahoo!, Gizmodo, Fast Company, and many more.

Let's talk

Starting a project? We’d love to talk to you about what we do and how we might help.

Get in touch