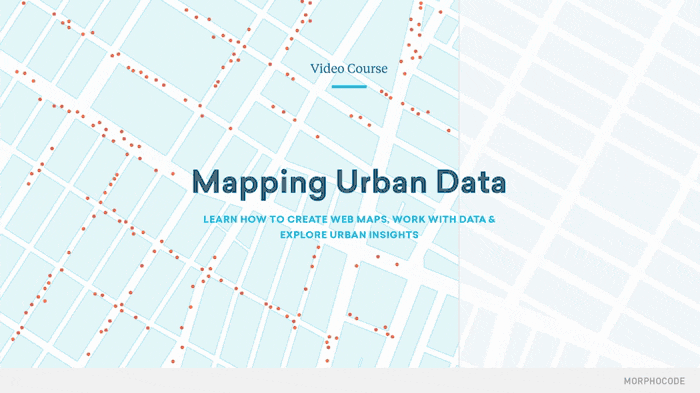
We are excited to share with you a preview of our video course Mapping Urban Data!
The course will cover the whole process of building an interactive web map: from urban data exploration and design principles to building the UI and adding interactivity with JavaScript.
Mapping Urban Data takes a hands-on approach to data visualization through a series of practical examples. The course covers a powerful workflow based on six steps: Story, Data, Map Design, Web Mapping, User Experience & Publishing.
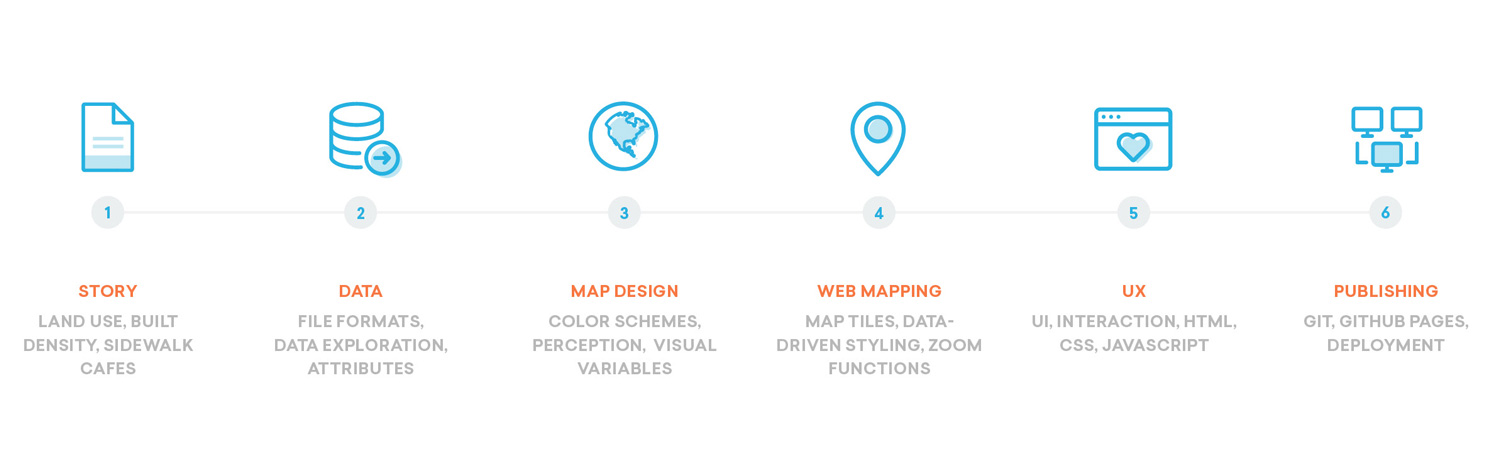
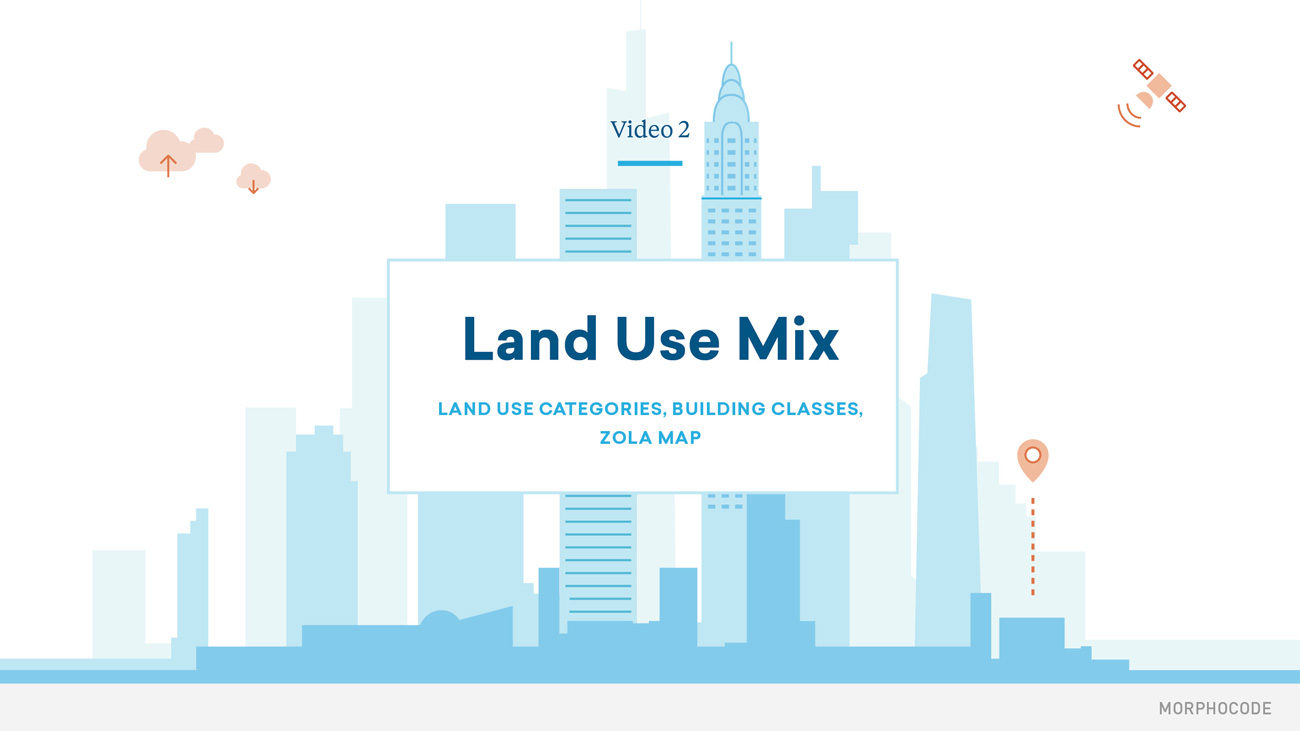
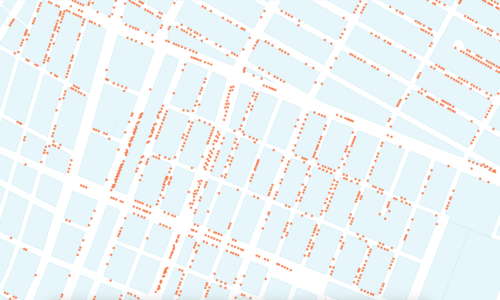
In this course we cover each step, focusing on the topic of Land Use in New York City. You will start with a raw dataset, explore its attributes, design a map, add interactivity and finally publish it on the web.
Here’s a short preview of what you might expect from each section:


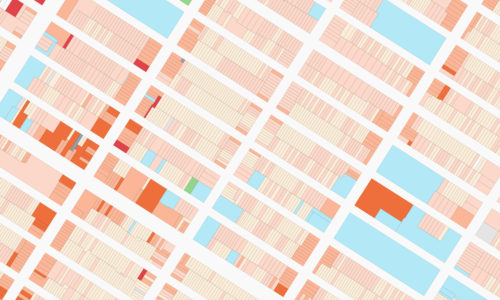
1. Story
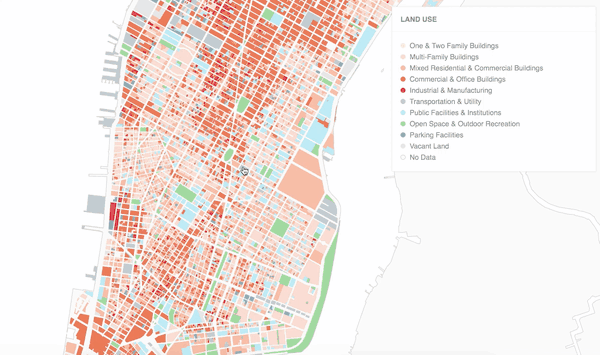
As a crucial part of almost every urban related study, Land use is a great introduction to the Mapping Urban Data course series. This is one of the most important components of urban form – both on the neighborhood level and on a broader city-wide scale.
Land use data is extremely versatile: it is useful for establishing the number of potential destinations in a neighborhood and determining the number of public spaces within a walking distance. Mapping land use can also provide a snapshot of urban diversity and support more general assumptions regarding neighborhood vitality and walkability.
2. Data
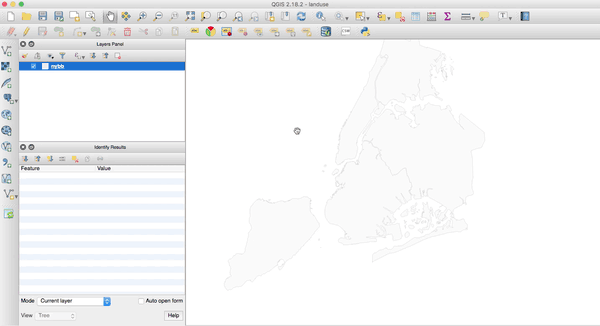
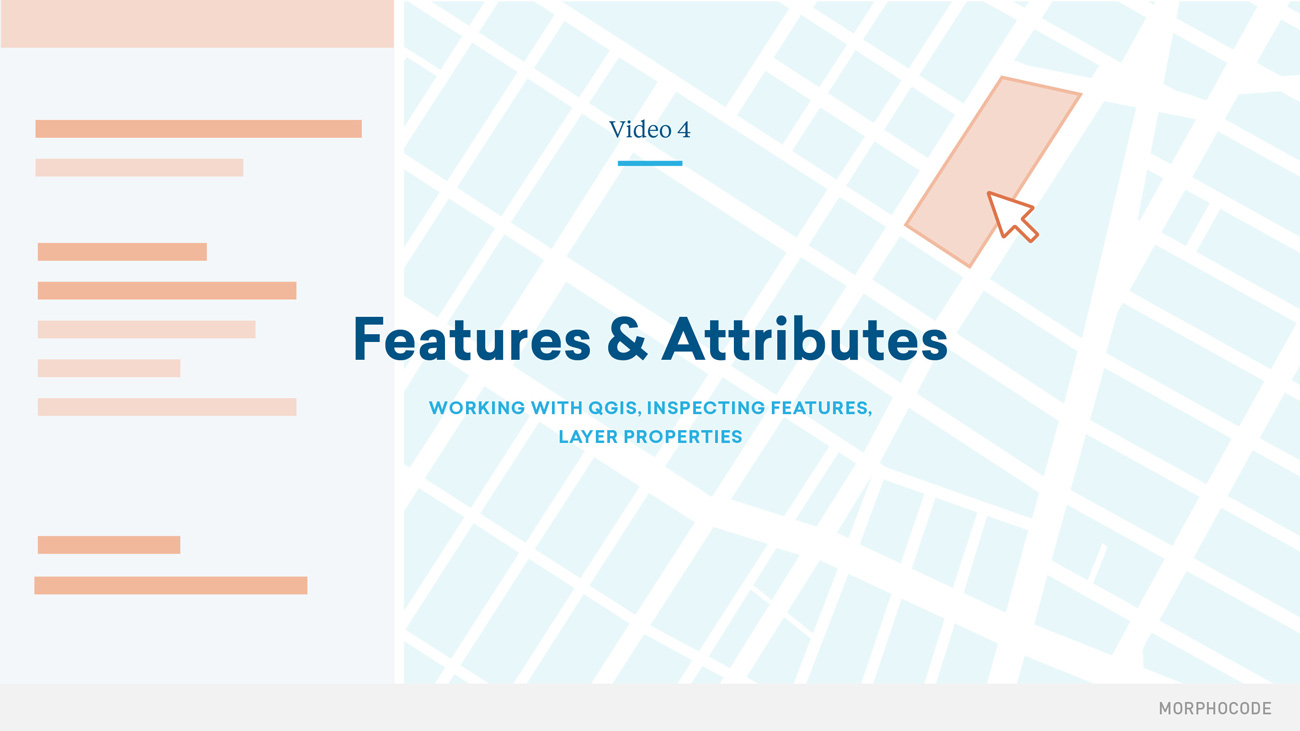
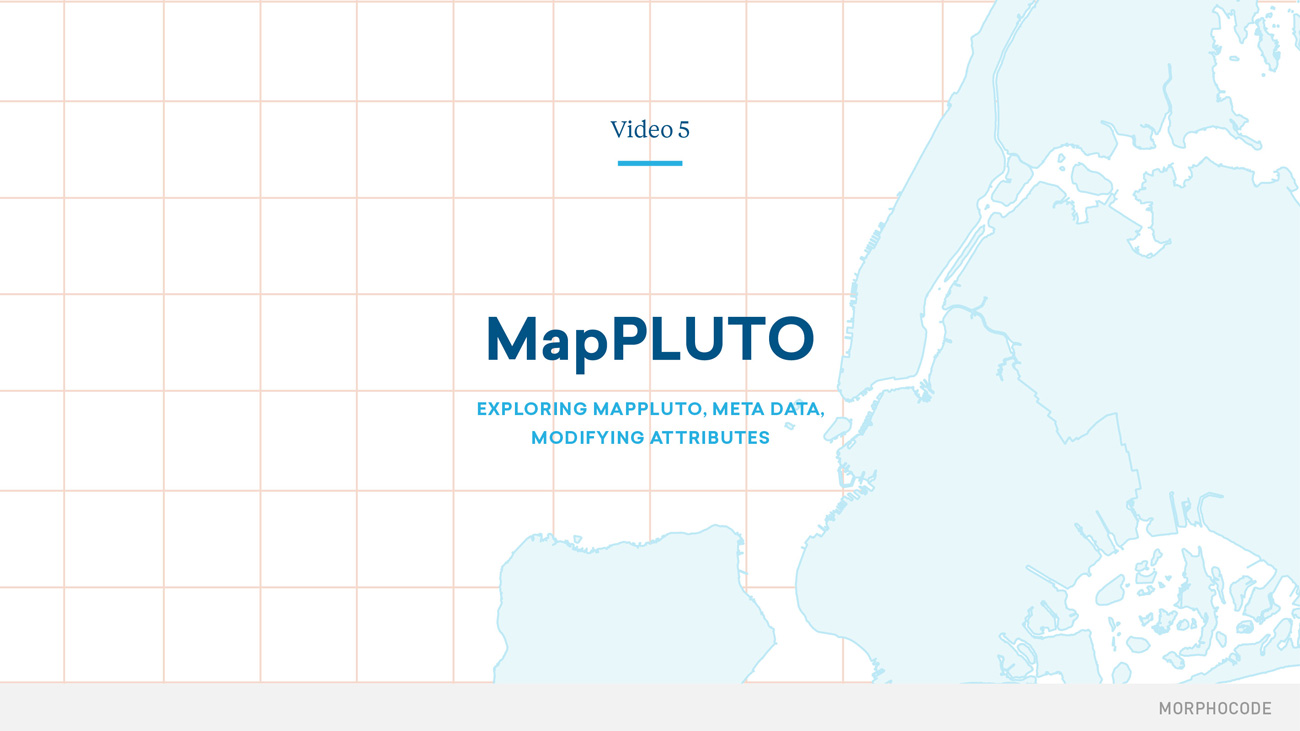
Unlocking the potential of data starts with data exploration. In the second step of the workflow we focus on working with geospatial data, data formats and GIS tools.
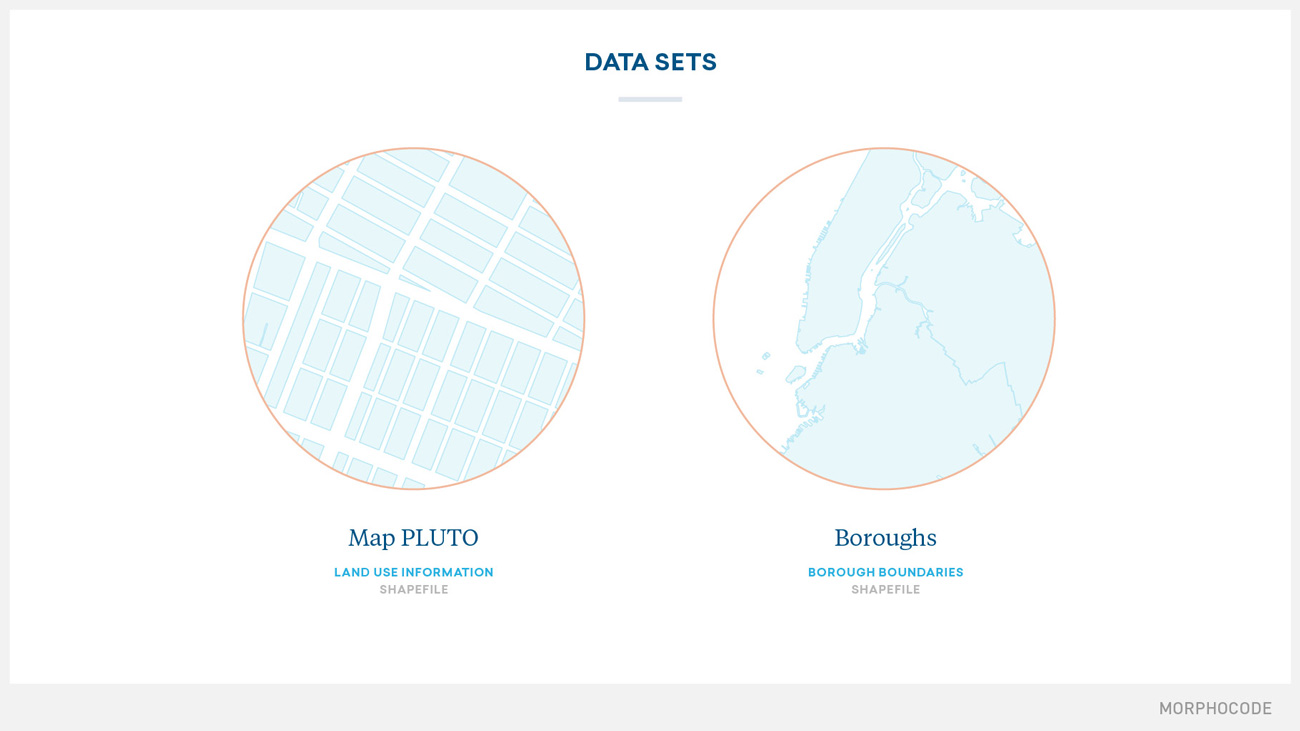
You will get familiar with the PLUTO dataset and explore its meta-data, context and structure. You will learn how to access, modify and explore common geospatial data formats; how to manage data attributes, style geometries and inspect features. Finally, we will prepare the dataset for web mapping by cleaning and refining the data attributes.
3. Map Design
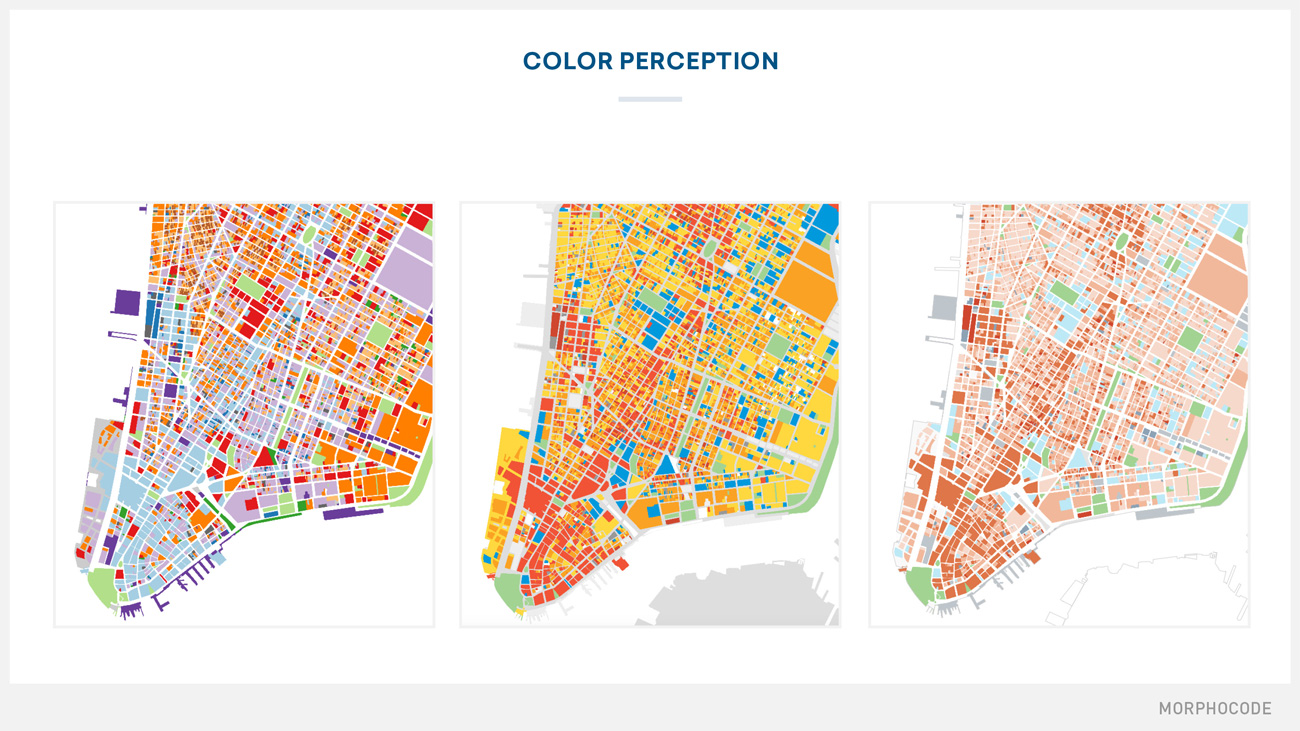
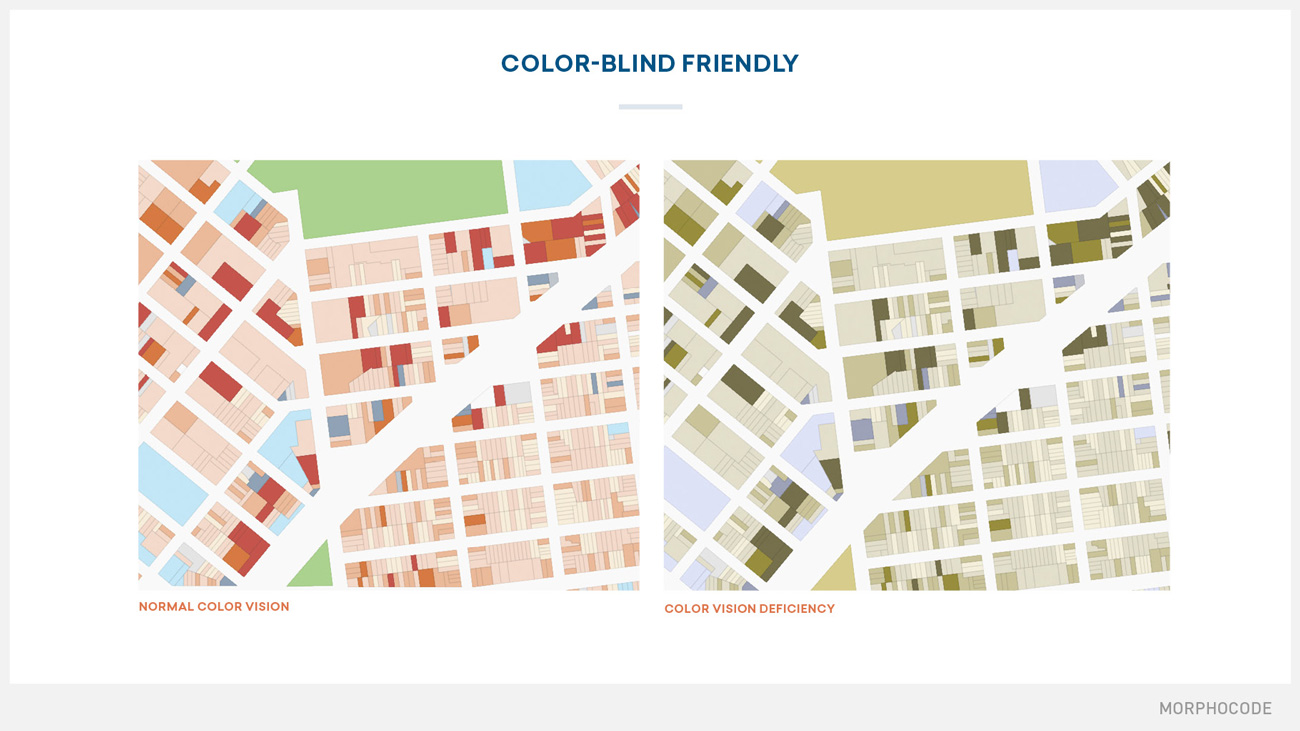
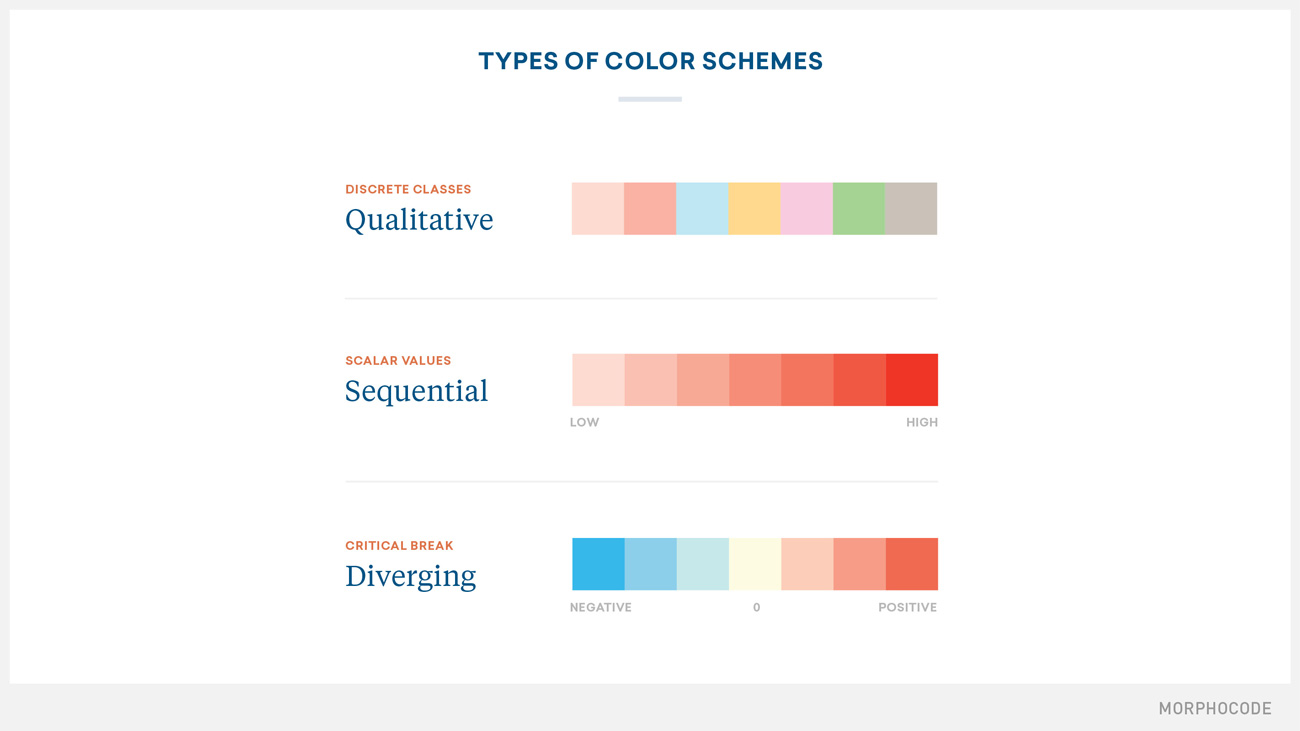
As any graphic creation, a map can benefit from the cautious combination of form, type and most of all – color.
In this section we will review some of the design principles and best practices in cartography. You will understand why design choices are critical not only for providing your audience with a visually appealing map but also for conveying the information correctly.
We will talk about the perceptual dimensions of color, visual variables and the importance of designing accessible maps. By the end of this section you will also learn how to choose the right color scheme based on the nature of your data and gain a better understanding of map perception.
4. Web Mapping
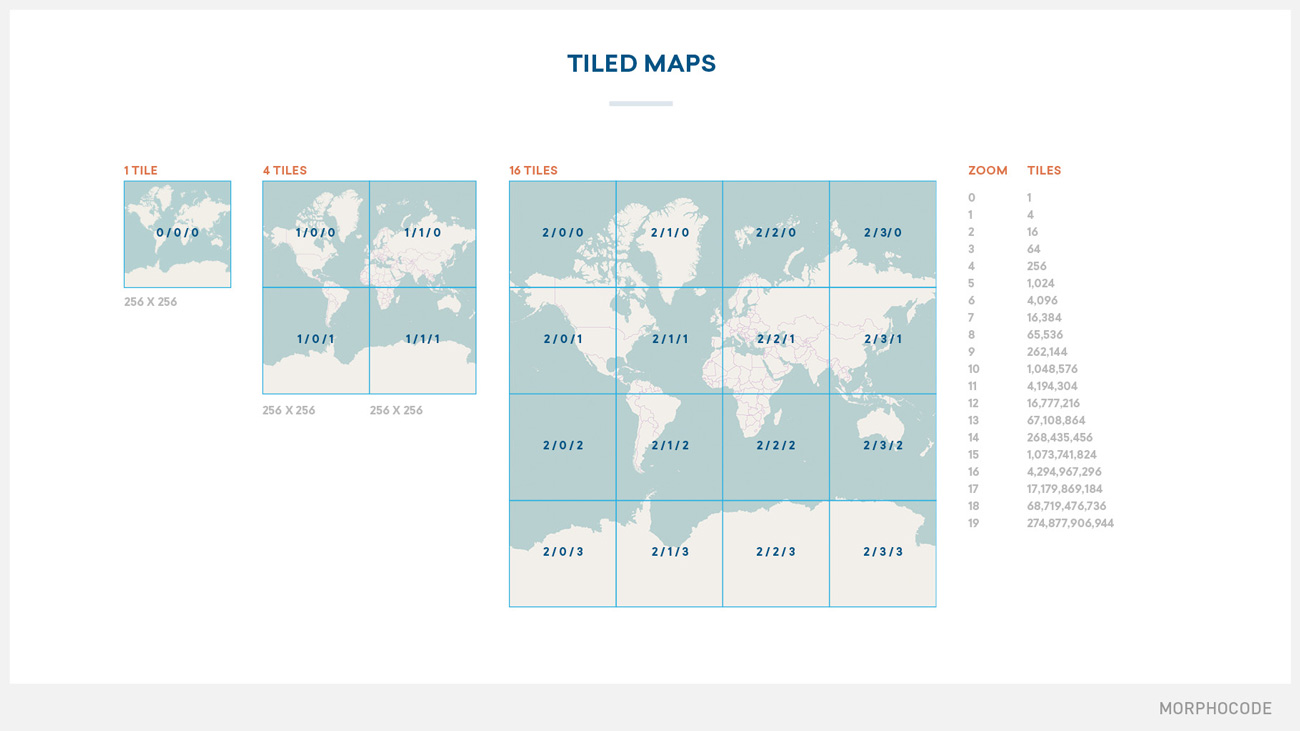
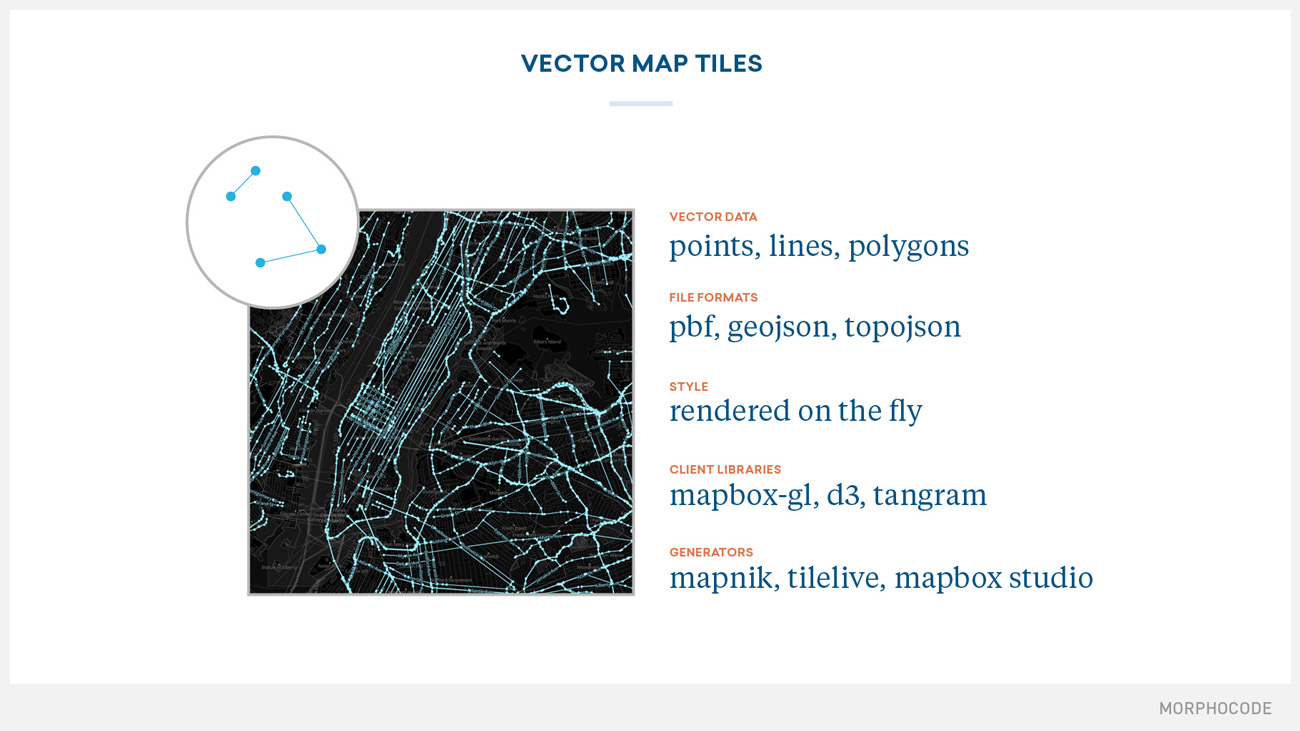
In this section we will talk about the fundamentals of web mapping: how web maps work in the browser, how we render the world into map tiles and what makes web maps so fast. You’ll get familiar with the most popular client libraries and tile generators; the differences between raster and vector tiles and what makes vector tiles a great choice for interactive visualizations.
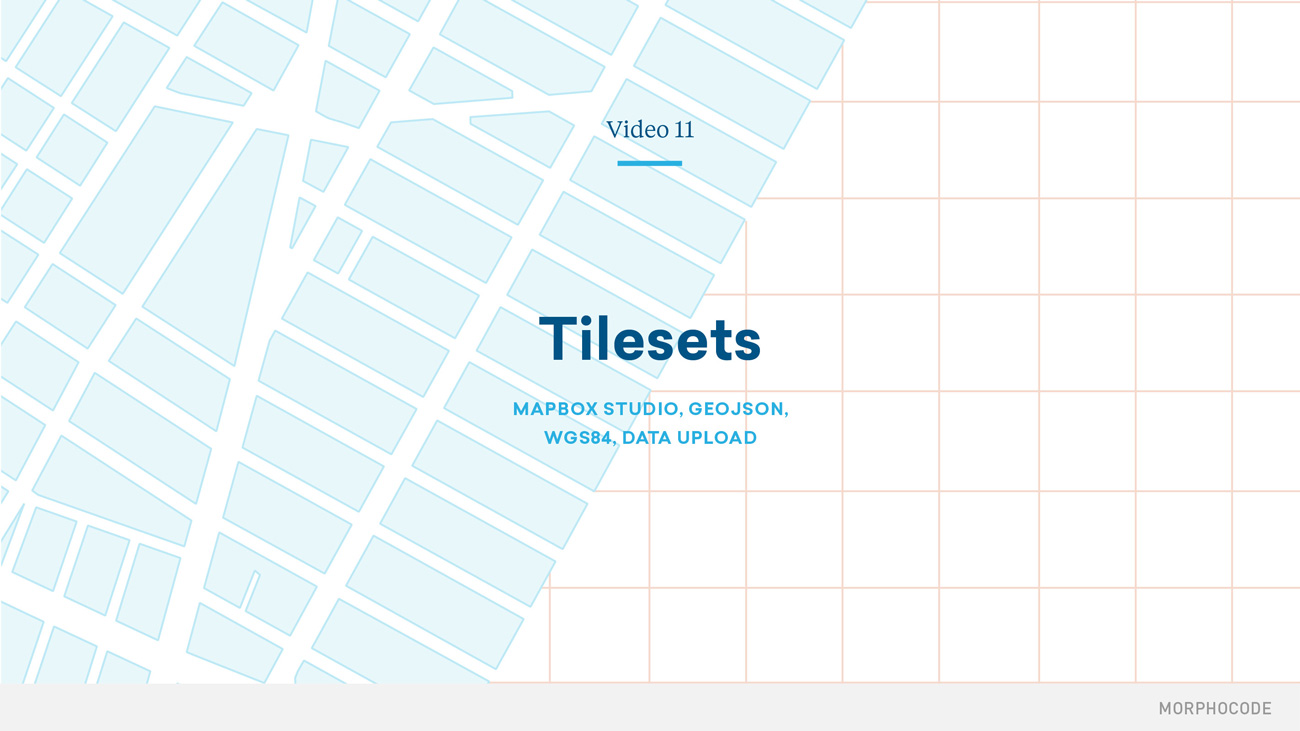
Next, you will take Mapbox Studio for a spin and create your own map style. We will talk about tilesets, zoom extents, layers and filters. Finally, we will apply data-driven styling and reveal details on demand through zoom functions.
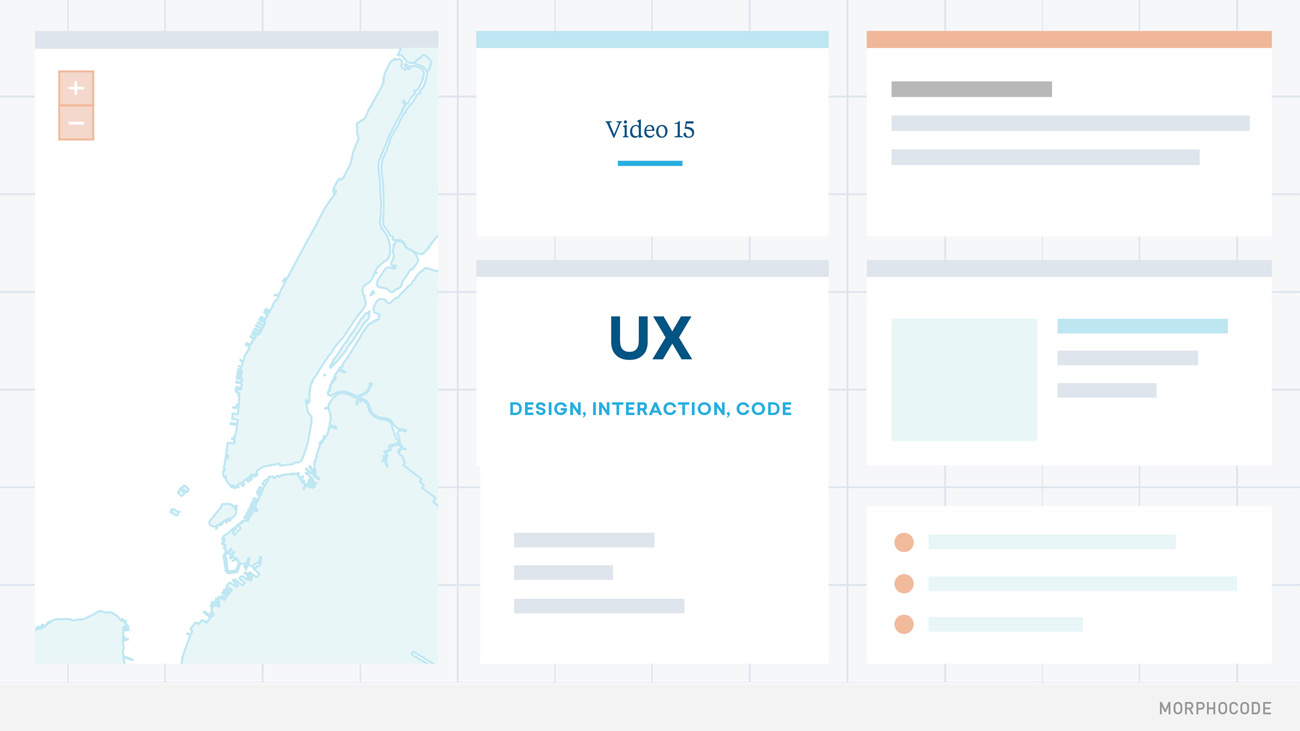
5. UX
This part of the course is dedicated to the User Experience of our project. That includes the process of designing the User Interface and adding interactions to our map. We will review some of the best mapping examples and see how we can combine different interactions, page layouts and UI components to enrich the User Experience.
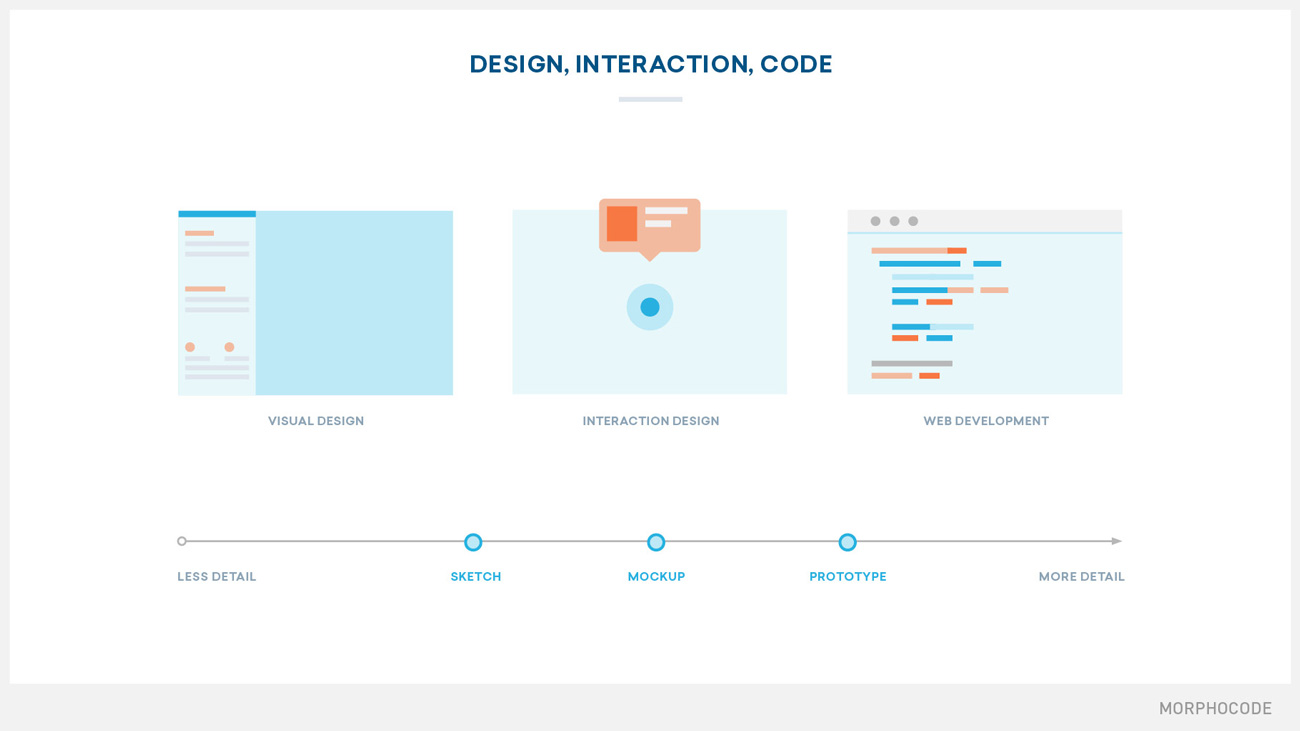
We will guide you in the transition from visual style editing to web development. You will create an interactive web map and build a custom map legend. Along the way, we will cover how HTML elements and attributes define the structure of the web document and how CSS declarations, selectors and rules control the visual look of the page.
Then, we will discuss how custom map interactions offer new possibilities to reveal data insights, inspect the map features and tell a better story. We will continue by adding a popup interaction and providing more information about selected lots.
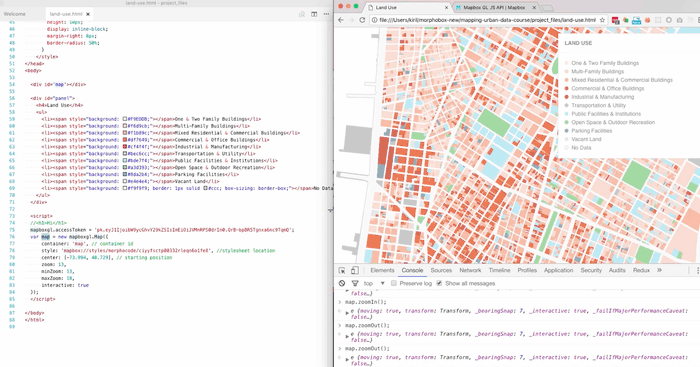
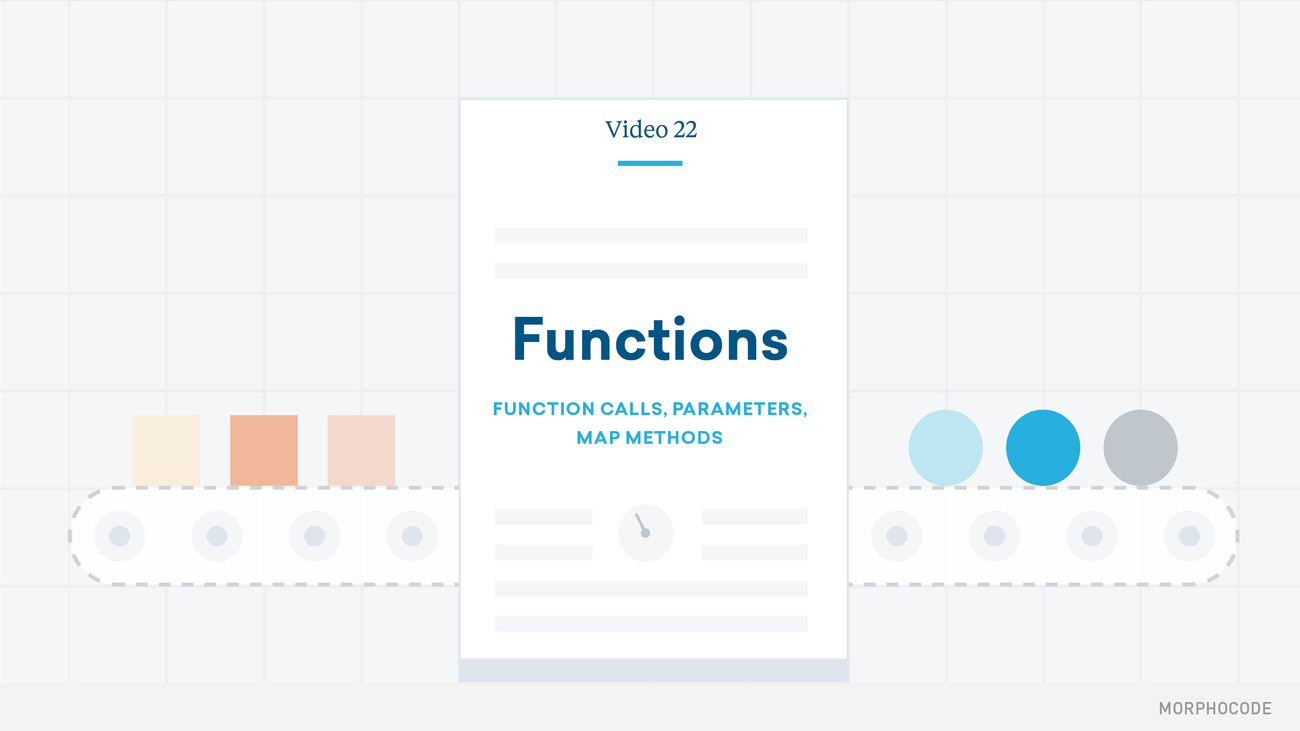
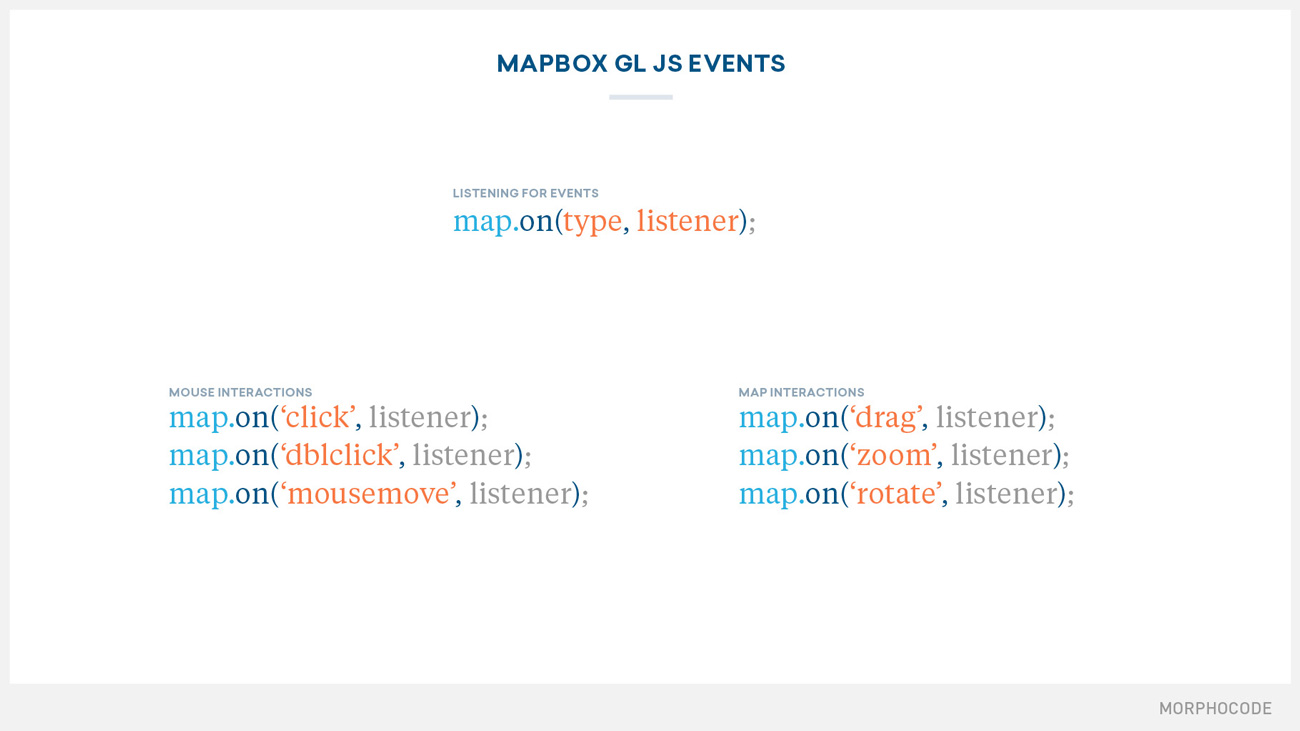
To get full control over the web map we will write JavaScript code. We will cover the fundamentals of working with data values, variables, object structures and functions. Then, we will continue with Mapbox GL JS – a modern JavaScript library for web mapping.
You will learn how to use custom map styles, control the map position, query the rendered features and handle user interactions among others. We will talk about declarations, expressions, arguments, map methods, function listeners and other key JavaScript concepts — all from a web mapping perspective.
6. Publishing
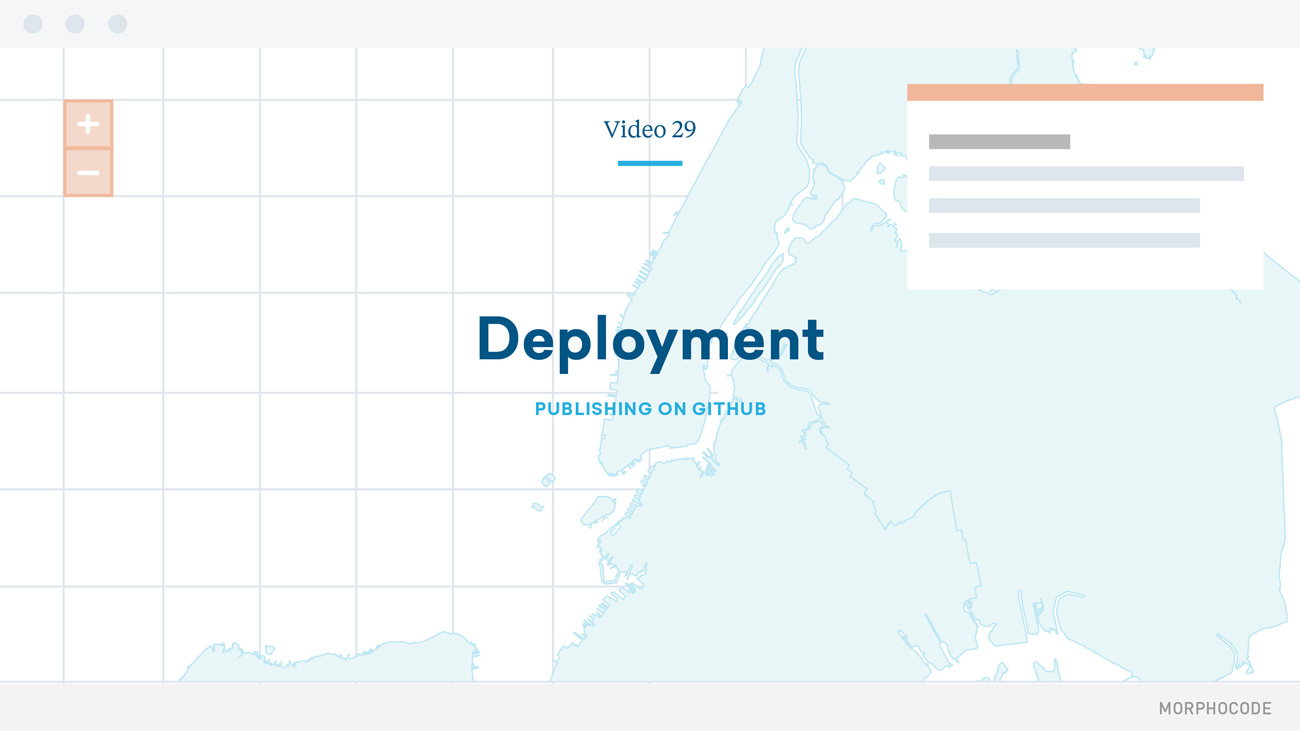
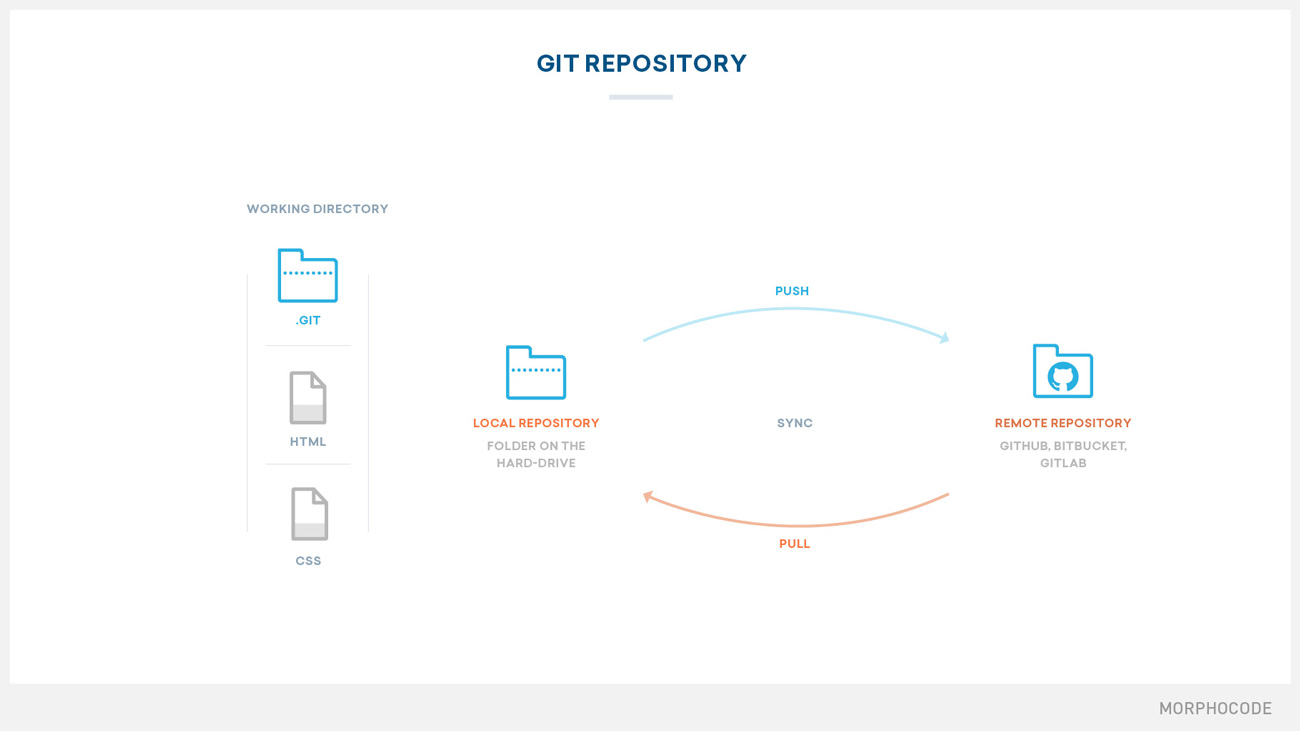
Finally, we will see how to publish our interactive map online. You will learn how to use git to keep track of code changes and how to deploy the project on a remote server.
Tools
Throughout the course, we will use several free and open-source tools. They will provide a solid base for your Mapping Data endeavours.
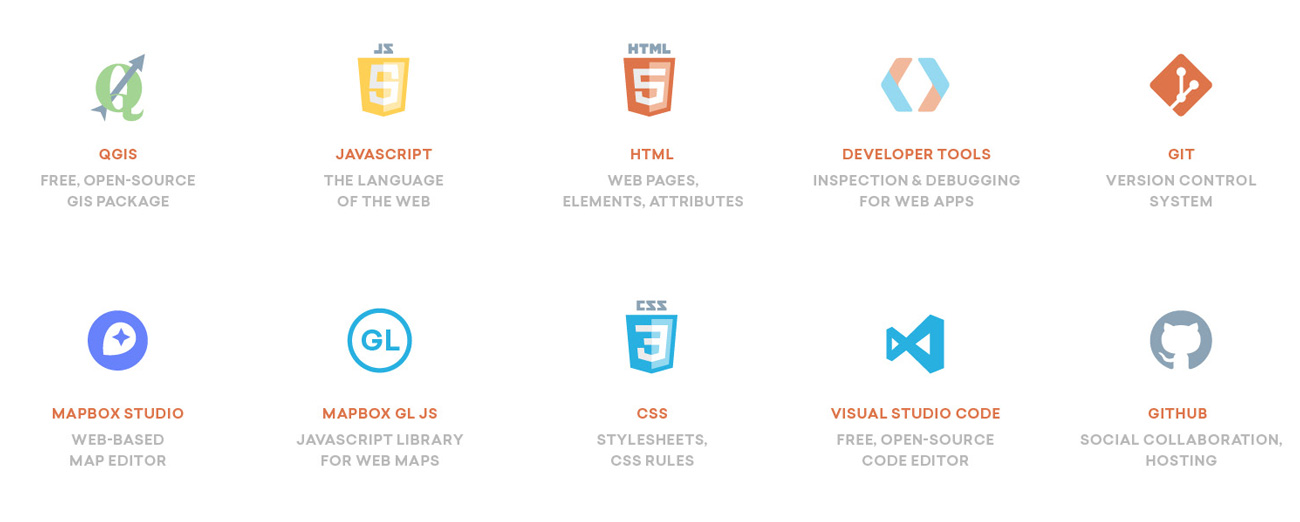
We will use QGIS to explore the geospatial datasets, Mapbox Studio to create and style our web map, and Open Web Standards such as HTML5, CSS and JavaScript to build an interactive urban data visualization.
To write JavaScript code we are going to use Visual Studio Code. We will use the Console API and Developer Tools to quickly iterate on features and fix errors. Git and Github Pages will provide code management and free hosting for our project.
30 videos. 4+ Hours of Content
We’ve put together more than 4 hours of content, carefully organized into 30 beautifully illustrated videos. Along the way, you will gain understanding of data formats, information design principles, cartography fundamentals and the coding skills required to finish the project.
Mapping Urban Data is suitable for architects, urban planners and data enthusiasts alike. It is beginner-friendly and does not assume previous knowledge of the topic. Users with experience in coding, GIS and web mapping can also benefit from the course by learning new practical skills and acquiring a better understanding of the whole process.
UPDATE: The course page is now live, with detailed information about its content, structure and key takeaways!
Hi, when will the course be available? Can´t wait !
Hi Ivana,
Thanks for your patience!
Part one of the Course will be launched by the end of the month.
Best Regards!
Hi, is this course already available?
Hi Mariko,
No, not yet but we are fully dedicated to bringing the course to life in the upcoming weeks.
We will send an email to all subscribers once the course is available. Updates will also be posted on our Facebook & Twitter page.
Thank you for your interest and patience!
Best Regards!
Hi, is there any info on the costs? Couldn’t find it.
Hi Lidia,
Thanks for reaching out!
We have just launched the course web page, where you can find information about its content, structure, key takeaways and pricing: http://io.morphocode.com/mapping-urban-data/
Best Regards!
Morphocode
Hi i want to pursue this course