Variations and local comparisons
The term Small Multiples was introduced and popularized by Eduard Tufte, who defined them as “graphical depictions of variable information that share context, but not content“. Small Multiples allow the comparative visual display of multivariable data that would otherwise be difficult to present in a single chart. Since all the elements share the same design and scale, once you’ve learned how to read a single element you can apply your knowledge to all the rest. Simplicity is crucial in order for the reader to focus on changes in the data.
Here are some of our favourite examples of the use of small multiples. For a wider selection you can chek out our Pinterest board.
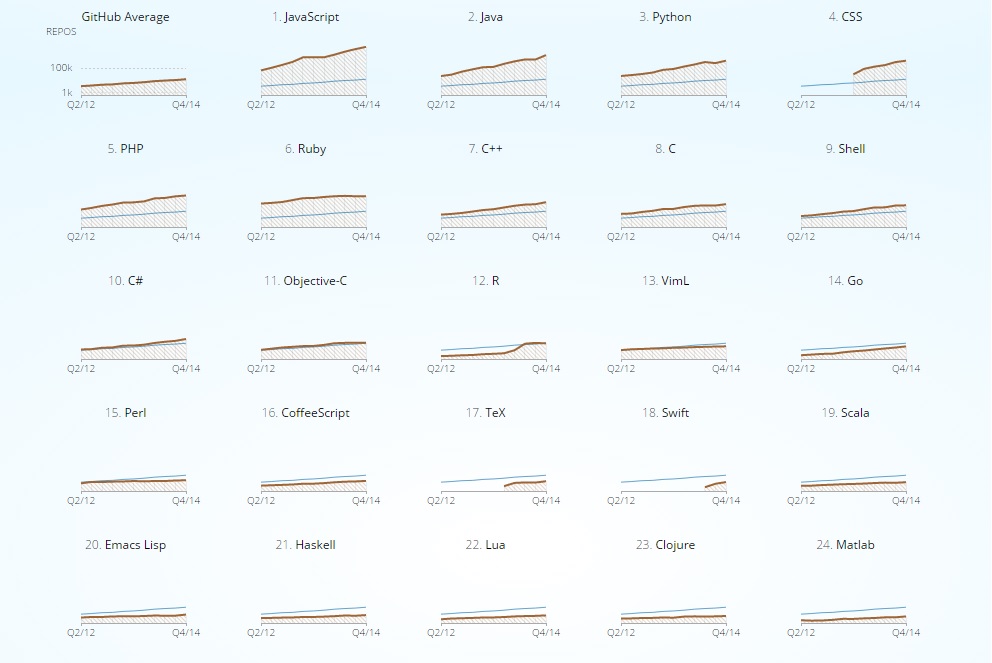
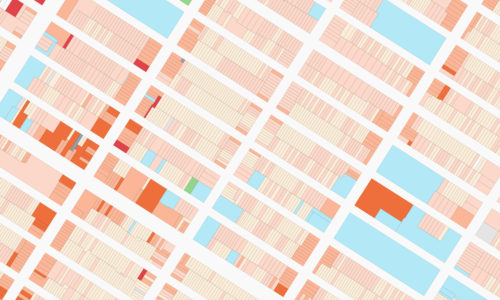
GitHut is a project by Carlo Zapponi that attempts to visualize and explore the complexity of the universe of programming languages used across the repositories hosted on GitHub. The quantitative data used in GitHut is collected from GitHub Archive and is updated on a quarterly basis.
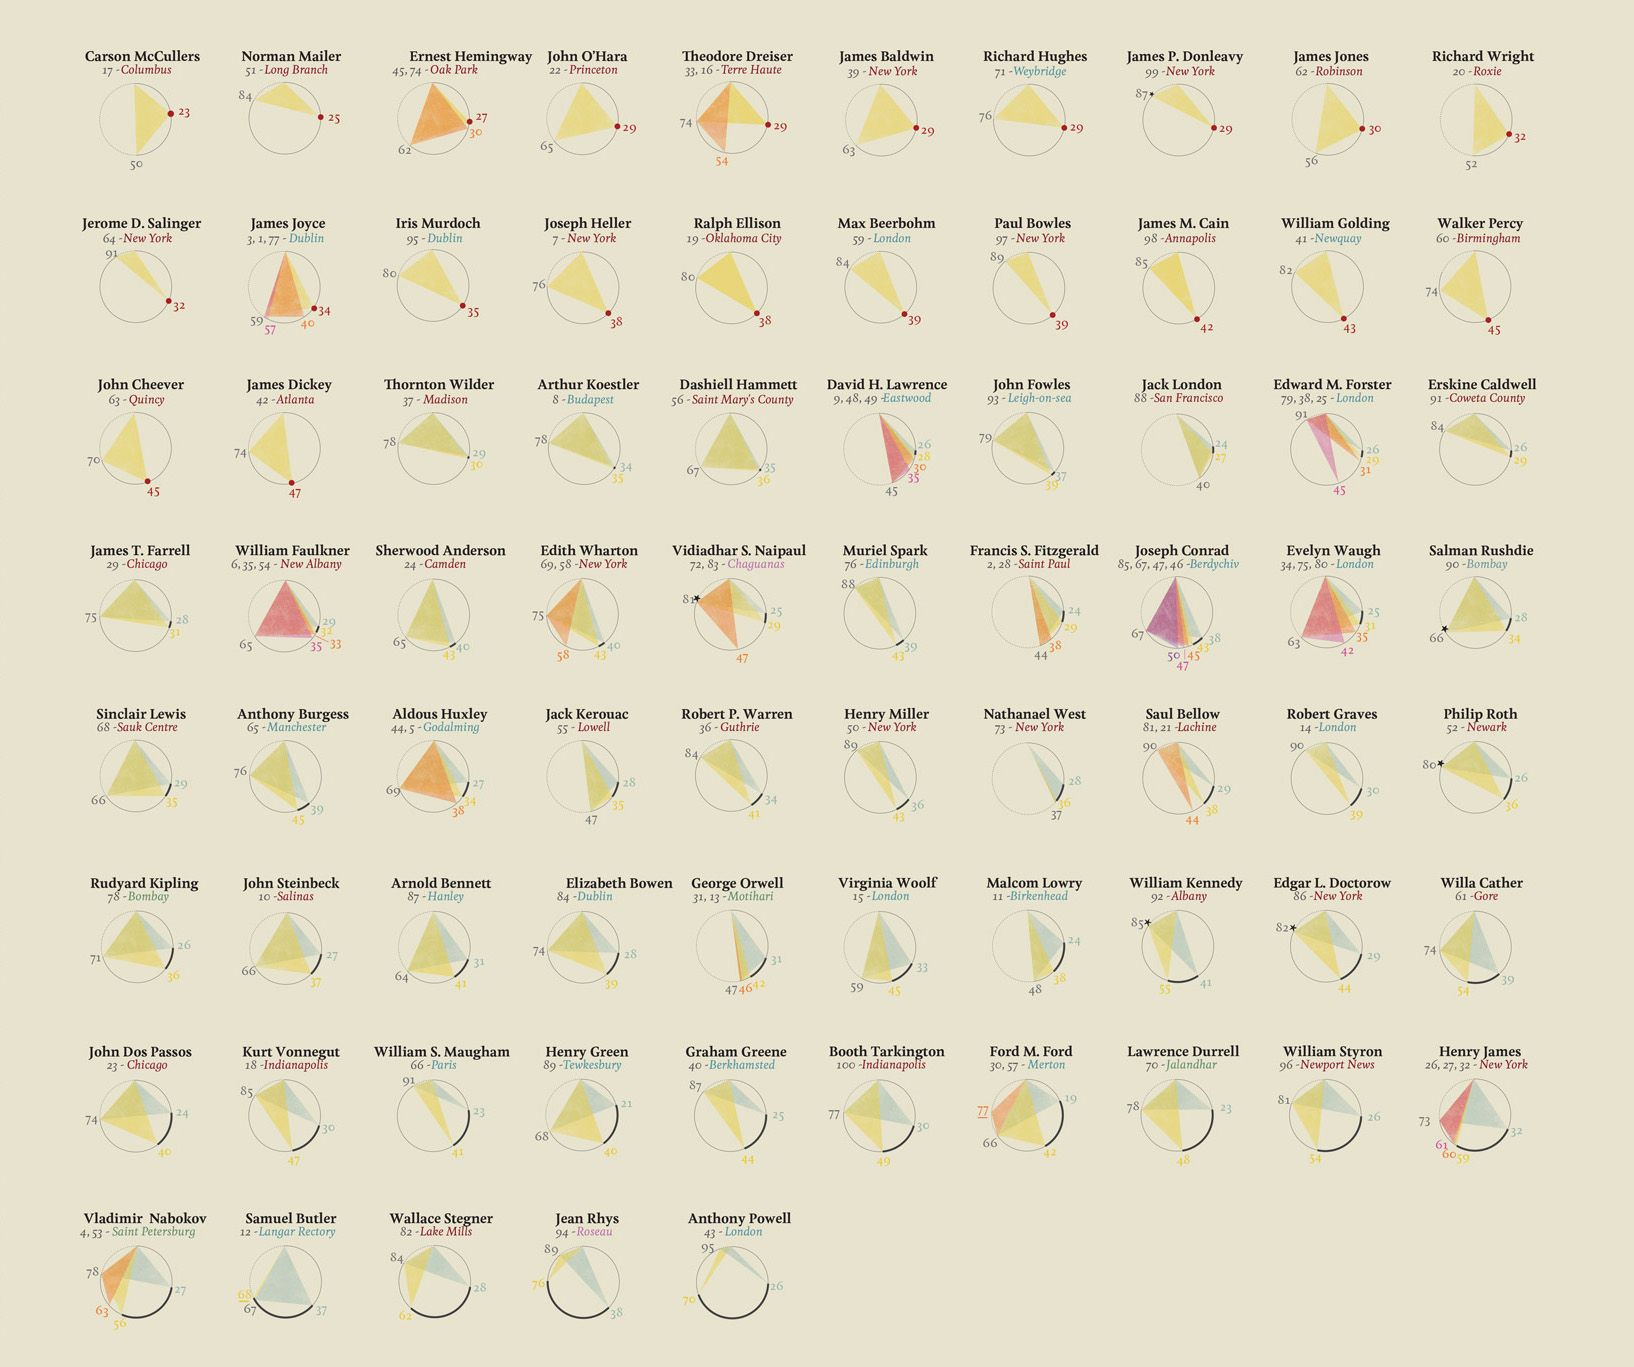
“From first published to masterpieces” visualizes the authors of the 100 best english novels as ranked by the Modern Library. Ordered from the earliest success to the last one, authors are represented through circles showing their life span and the moment of their debut novel and consecutively published masterpieces. The visualization contains also information about the author’s hometown and novels’ ranking. It is designed and produced by Accurat and was originally published in italian on La Lettura.
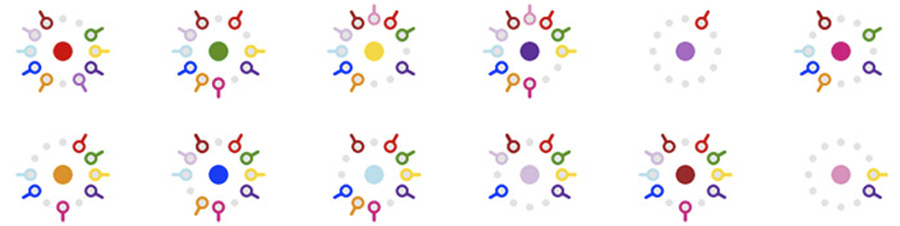
Shanghai Metro Flow is a project by Till Nagel and Benedikt Groß that visualizes the pulse of Shanghai’s subway network – one of the busiest and fastest growing rapid transit systems in the world. The project consists of an animation with three network visualizations, and an accompanying infographic poster showing subway line details. Connections between different lines are visualized via small multiple glyphs that take the shape of a 12h clock so that each line is always displayed at the same angle. You can read the accompanying paper “Shanghai Metro Flow – Multiple perspectives into a subway system“.
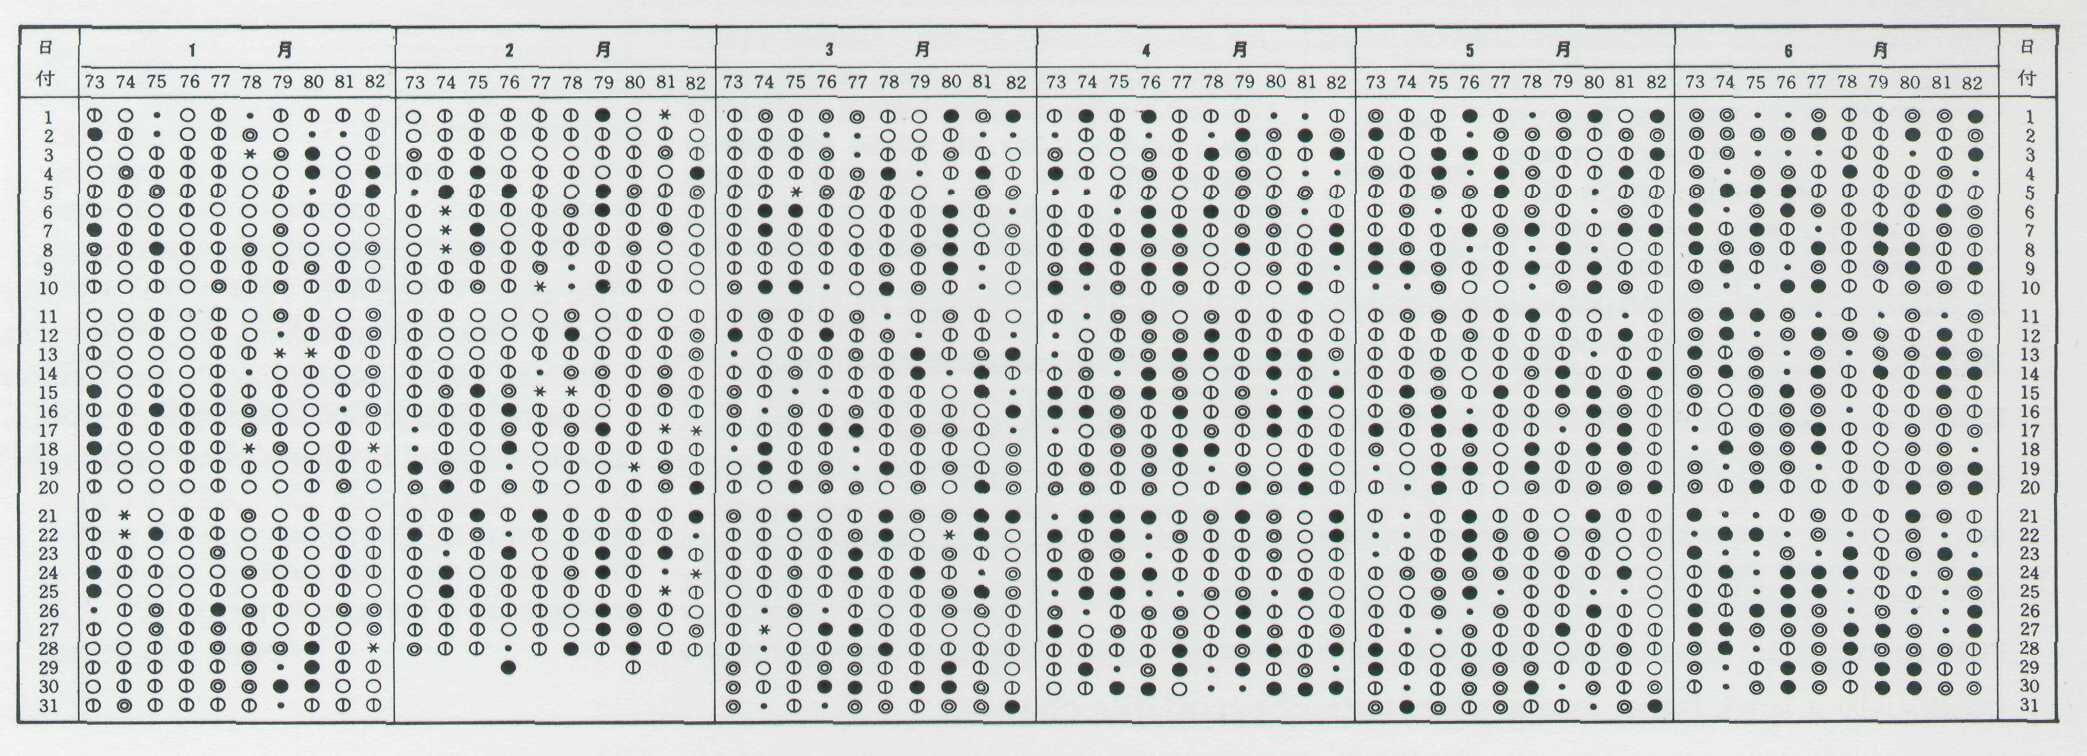
This high-information density graphic is a classical example of a small multiple. It visualizes a concentrated history of Tokyo’s climate: a full decade of observations by town, year, month, and day. The 1,826 days of weather history range from ![]() – Clear;
– Clear; ![]() – Fair;
– Fair; ![]() – Cloudy to
– Cloudy to ![]() – Light Rain;
– Light Rain; ![]() – Rain and
– Rain and ![]() – Snow. The image originates from a 1984 Meteorological Almanac by The Meteorology Agency and Japan Meteorology Association. It was redrawn and published in Edward Tufte’s “Envisioning Information“.
– Snow. The image originates from a 1984 Meteorological Almanac by The Meteorology Agency and Japan Meteorology Association. It was redrawn and published in Edward Tufte’s “Envisioning Information“.
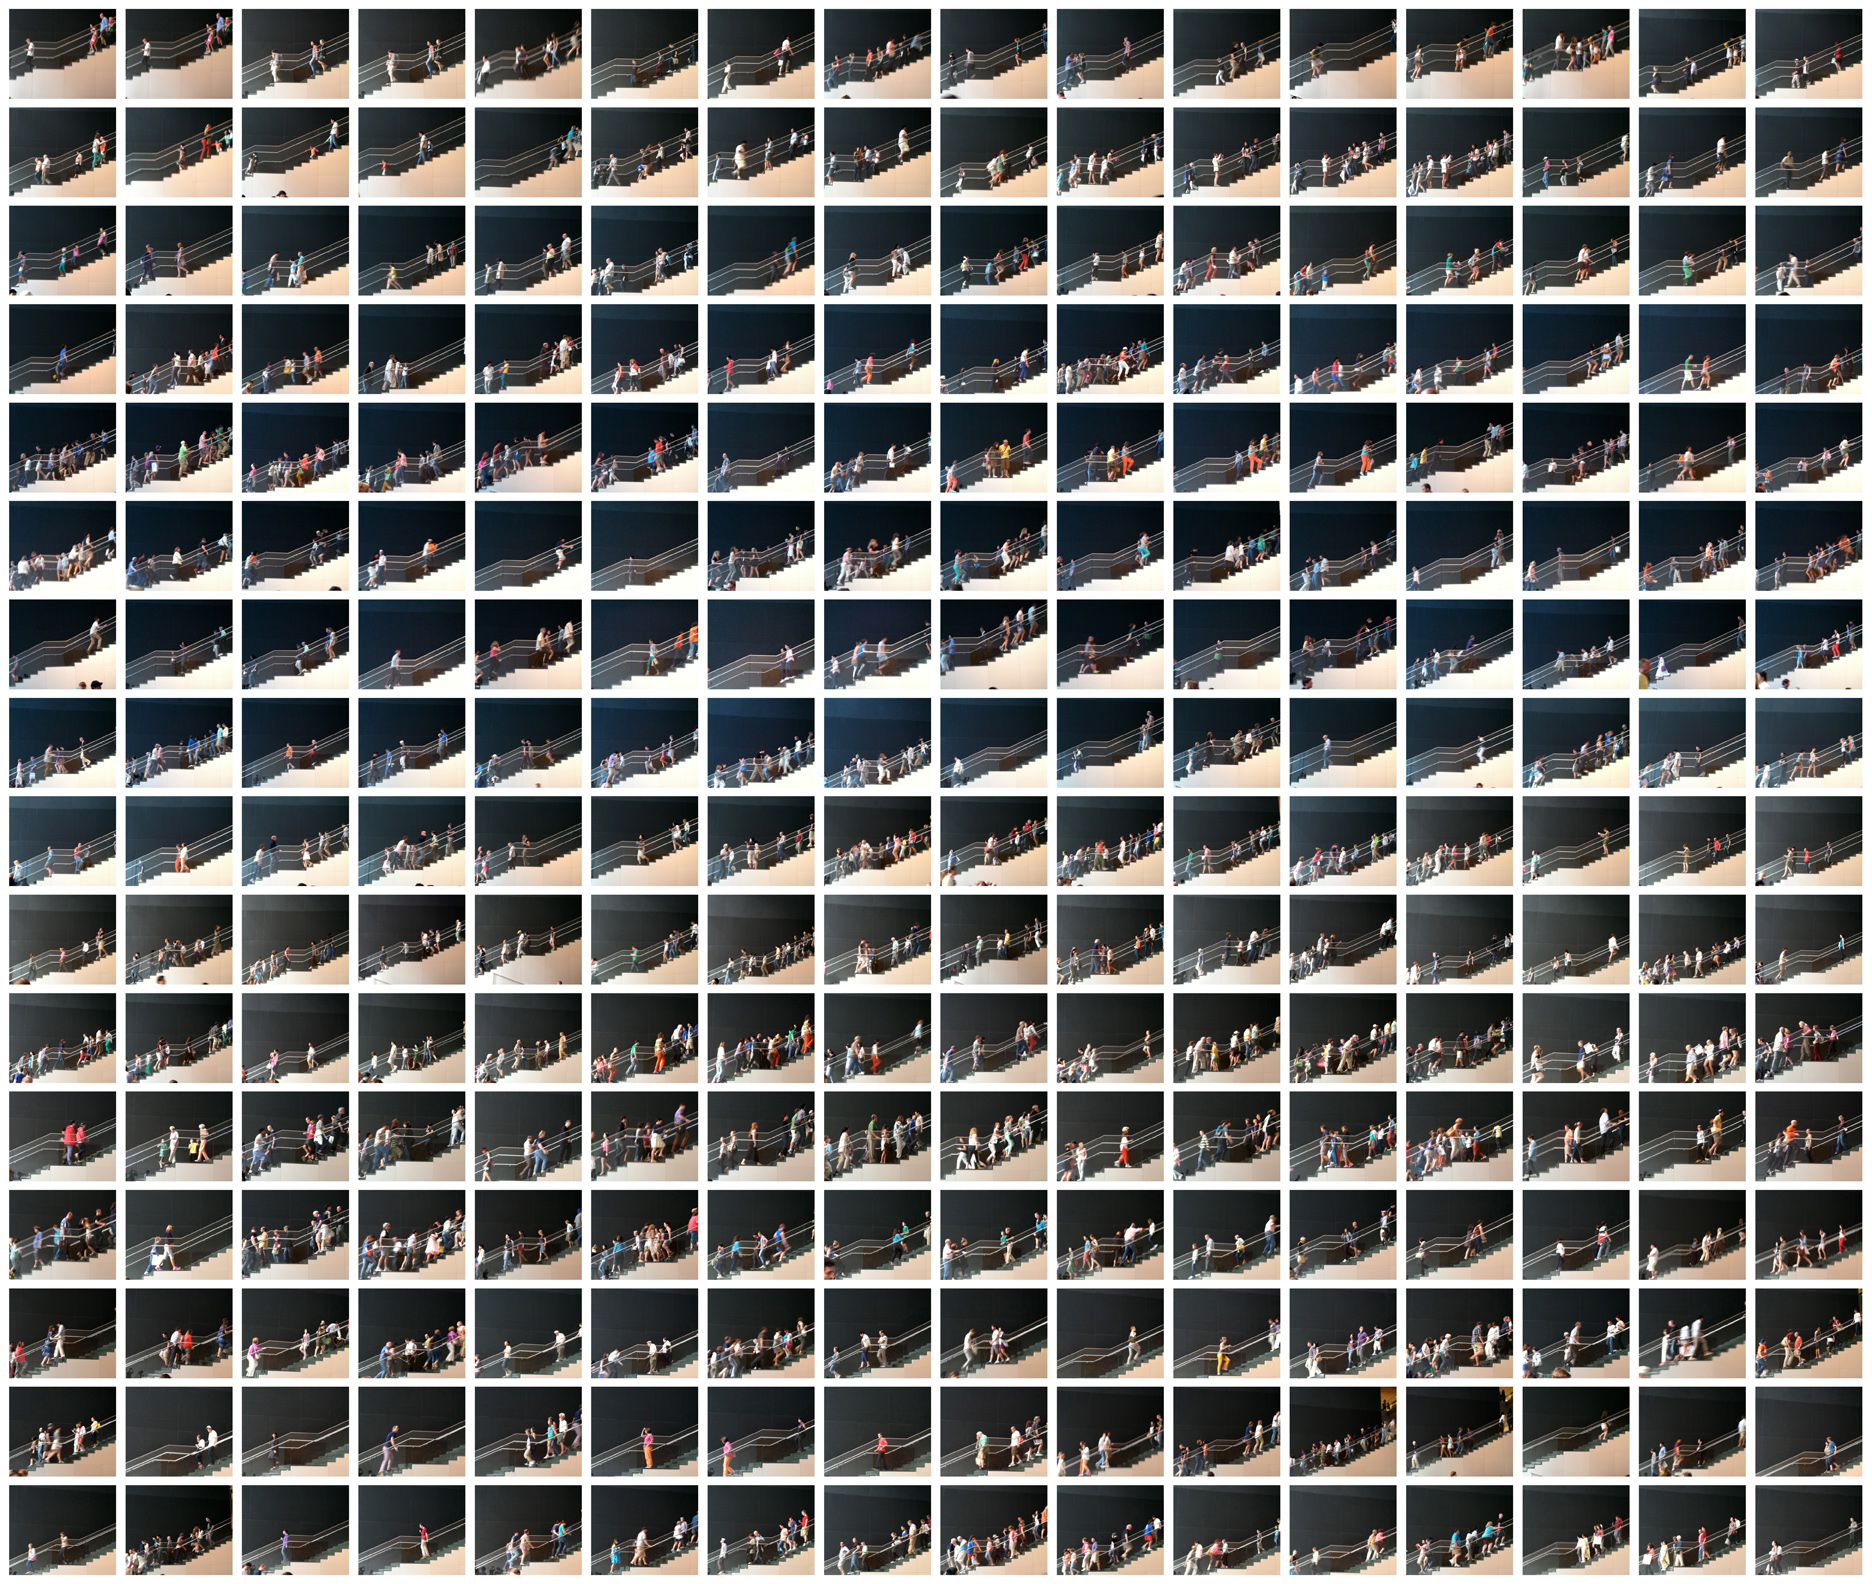
“People on Staircase in Motion” by Jerome Marshak is an art piece that includes 5,000 single images taken in the course of a 6-week study of pedestrian activity on MOMA strairs in June and July, 2012.
“Small multiples, whether tabular or pictorial, move to the heart of visual reasoning – to see, distinguish, choose. Their multiplied smallness enforces local comparisons within our eyespan, relying on an active eye to select and make contrasts rather than on bygone memories of images scattered over pages and pages.”
E. Tufte
Small Multiples in Architecture
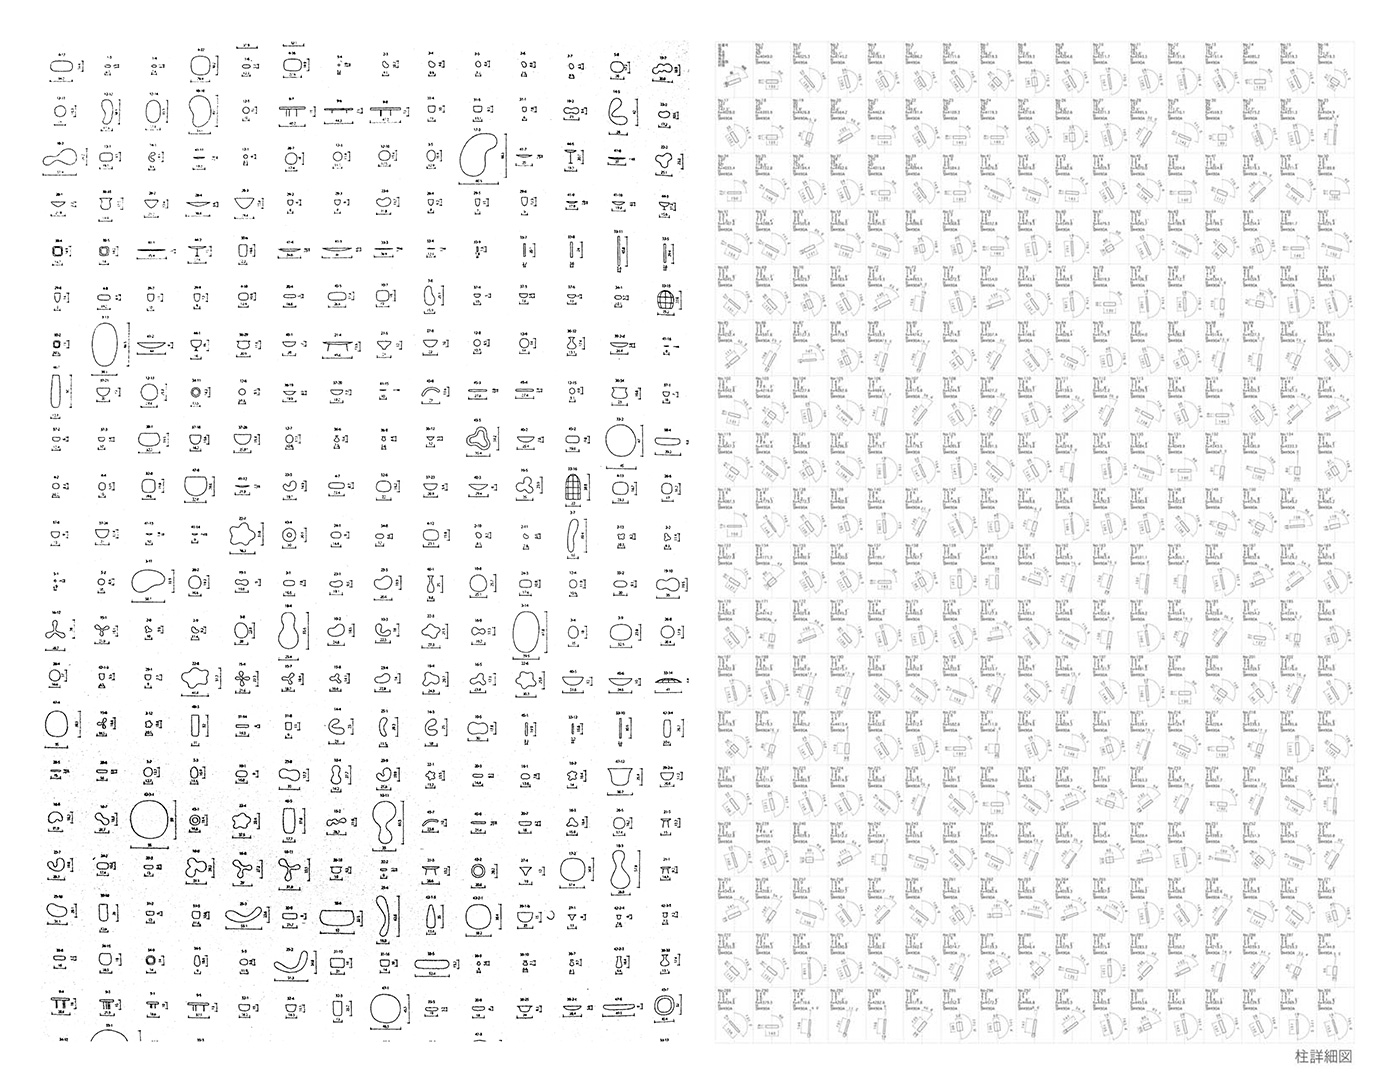
Diagrammatic reasoning and visual representation of multiple variations in a given context are fundamental parts of the architect’s toolkit. The study of a single element and the scope of its alternatives can result in an entire spatial strategy. Such is the case, for example, in Junya Ishigami’s KAIT workshop where the position of the 305 columns, non of which identical in orientation and proportion, give rise to countless circulation paths and diverse environments.
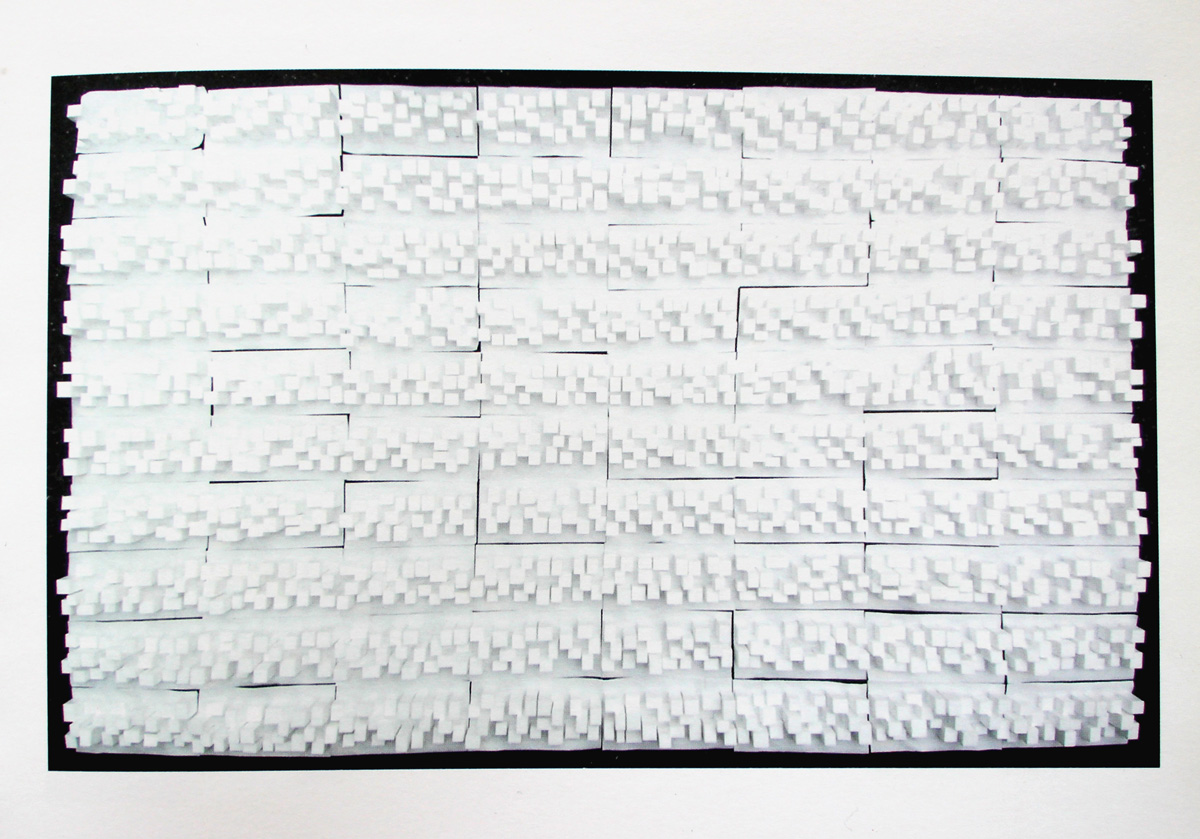
“Little Gardens” and KAIT workshop: visual explorations and spatial strategies.
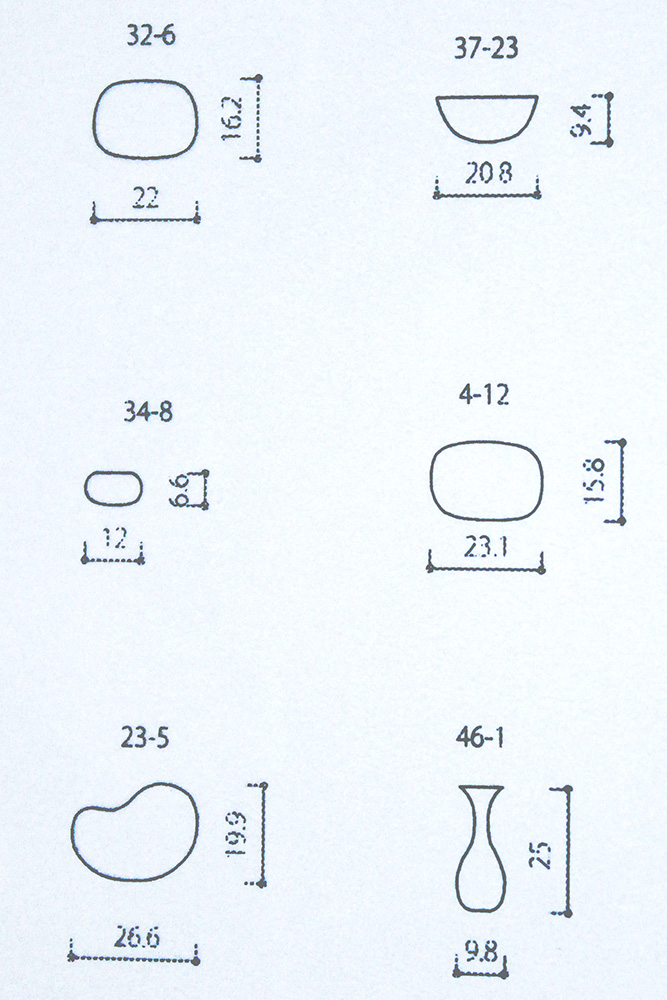
If you browse through the pages of JA78 you will come across a couple of Junya Ishigami‘s projects who differ largely in scale but share the same level of elaboration and care for the detail. On one side – 384 miniature gardens all the size of a fingertip; on the other – an unit study for the 305 slender columns of Kangawa Institute of Technology workshop. They all coexist peacefully on two adjacent pages and reveal a spatial strategy that blurs the boundaries between the notions of space and landscape. Meanwhile the graphical display of the their variability enables direct comparison of all the instances in each context – an approach that is intrinsic to Tufte’s definition of Small Multiples.
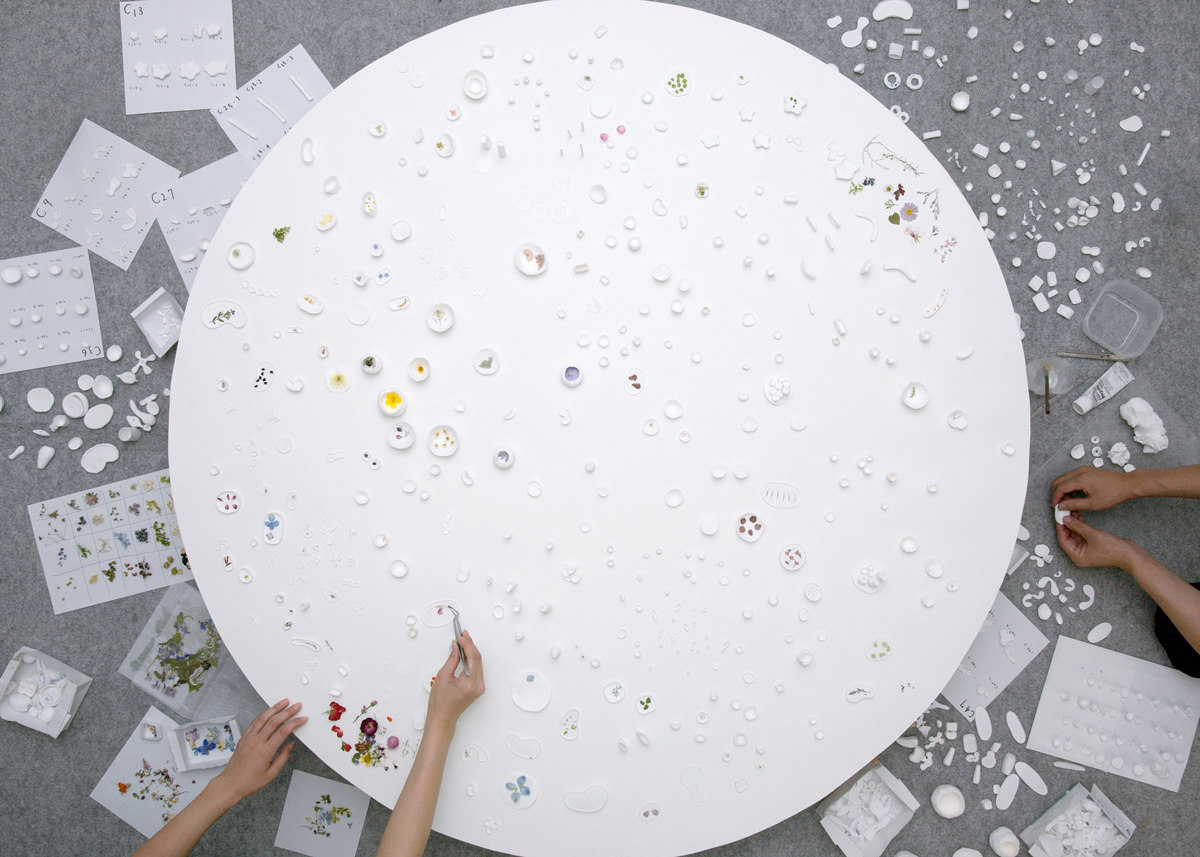
“Little Gardens” is a miniature installation that fits on the top of a single table. It was designed in 2007 as a part of an exhibition during Tokyo Design Week when five japanese architects, including Junya Ishigami, were invited to create an unique piece of art around the theme of a “box”. According to Ishigami, each miniature element works both as a little flower vase and as a space container – a tiny “exhibition room” for pressed flowers. Thoroughly catalogued and labeled, the innumerable containers are displayed as an entity on a round table where they form spatial clusters and ultimately – a whole landscape.
In these two projects, I prioritized neither “spaces” nor “landscapes”.
Junya Ishigami
Kanagawa Institute of Technology workshop (also known as a “White forest in a grey field”) is Junya Ishigami’s first realized building. The 2000 square-meter workshop hosts 14 loosely defined open spaces, dedicated to diverse activities. Within their ambiguous boundaries one will come accross four multipurpose work spaces; a small supply shop; specialized areas for pottery, woodworking, computer graphics, metal casting, and other.
The act of movement was treated with special care:
“In architecture, plans determine the flow of circulation through spaces. Yet, when there are various routes to choose from, people generally use those they like best. The choice may be a reflection of taste or of one’s own rationality. Always passing along the same route may lend a certain sense of ease. On occasion, one chooses another route introducing a change of pace. One wonders just how many different routes are available within this building.”
J. Ishigami
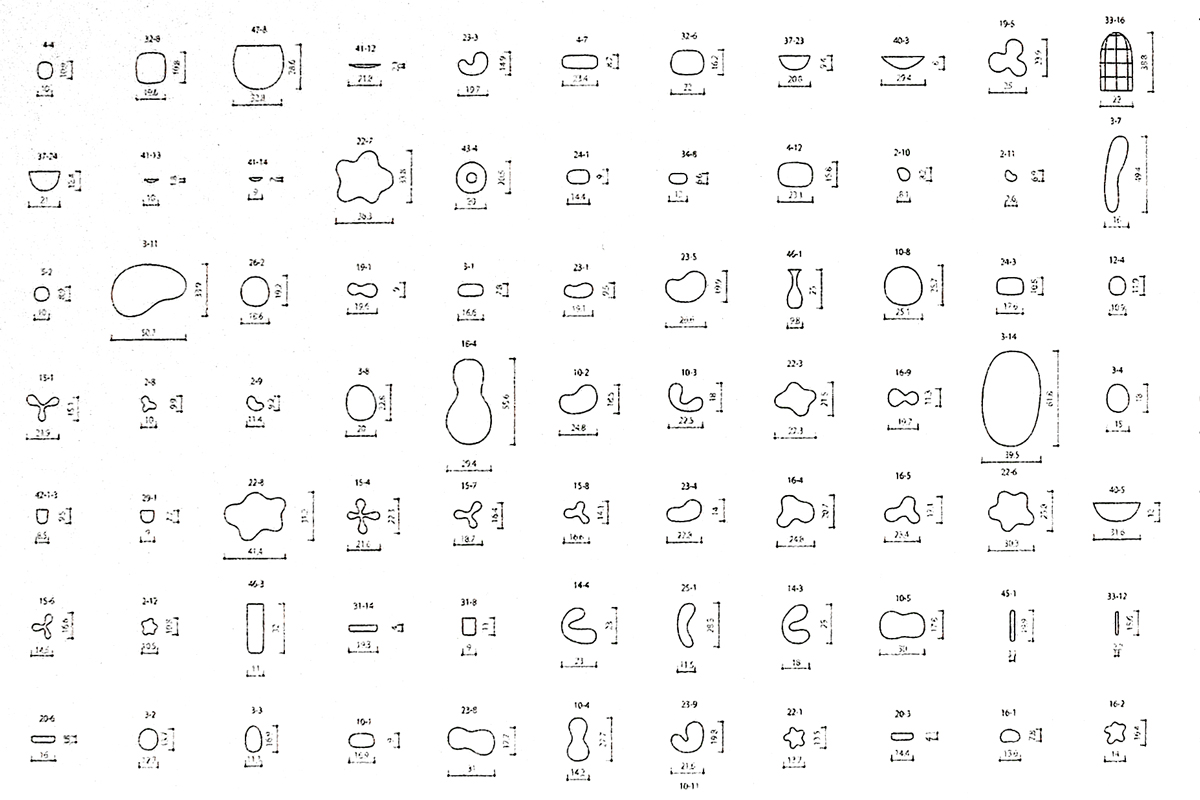
Ambiguity as a spatial strategy: column permutations
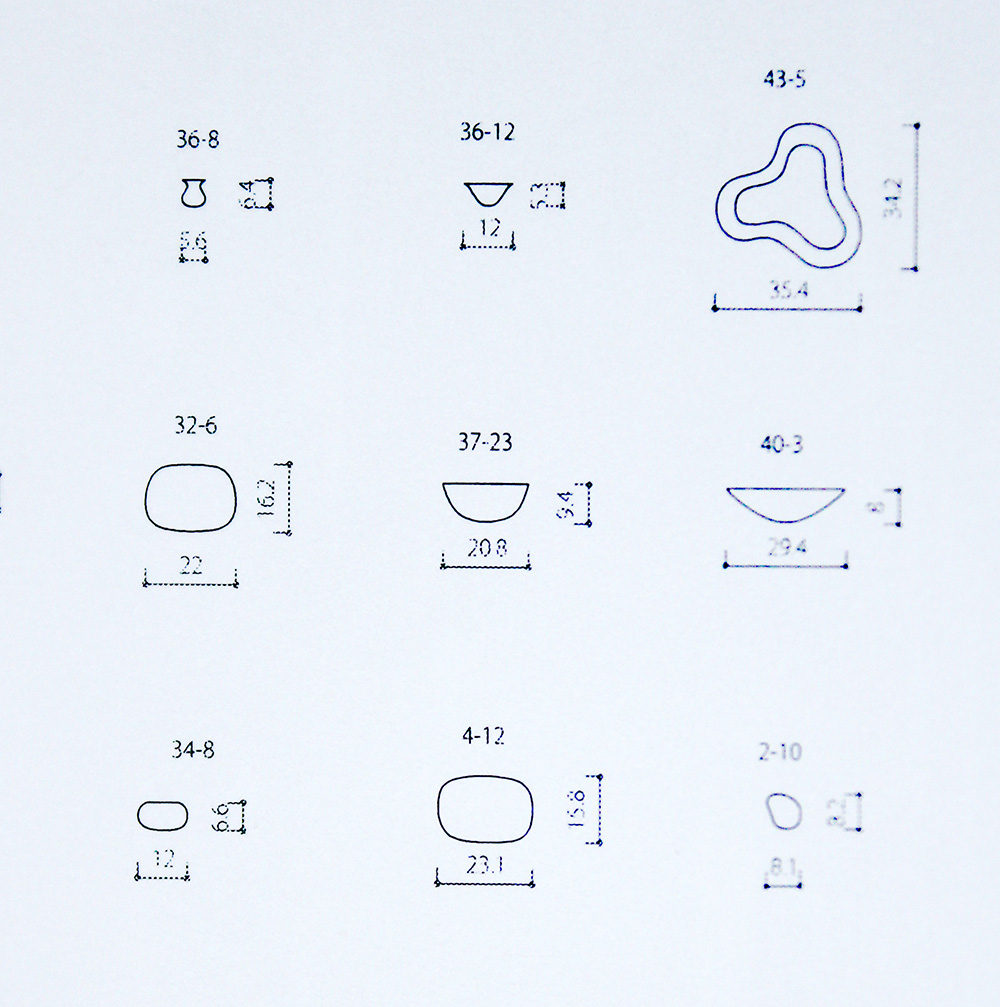
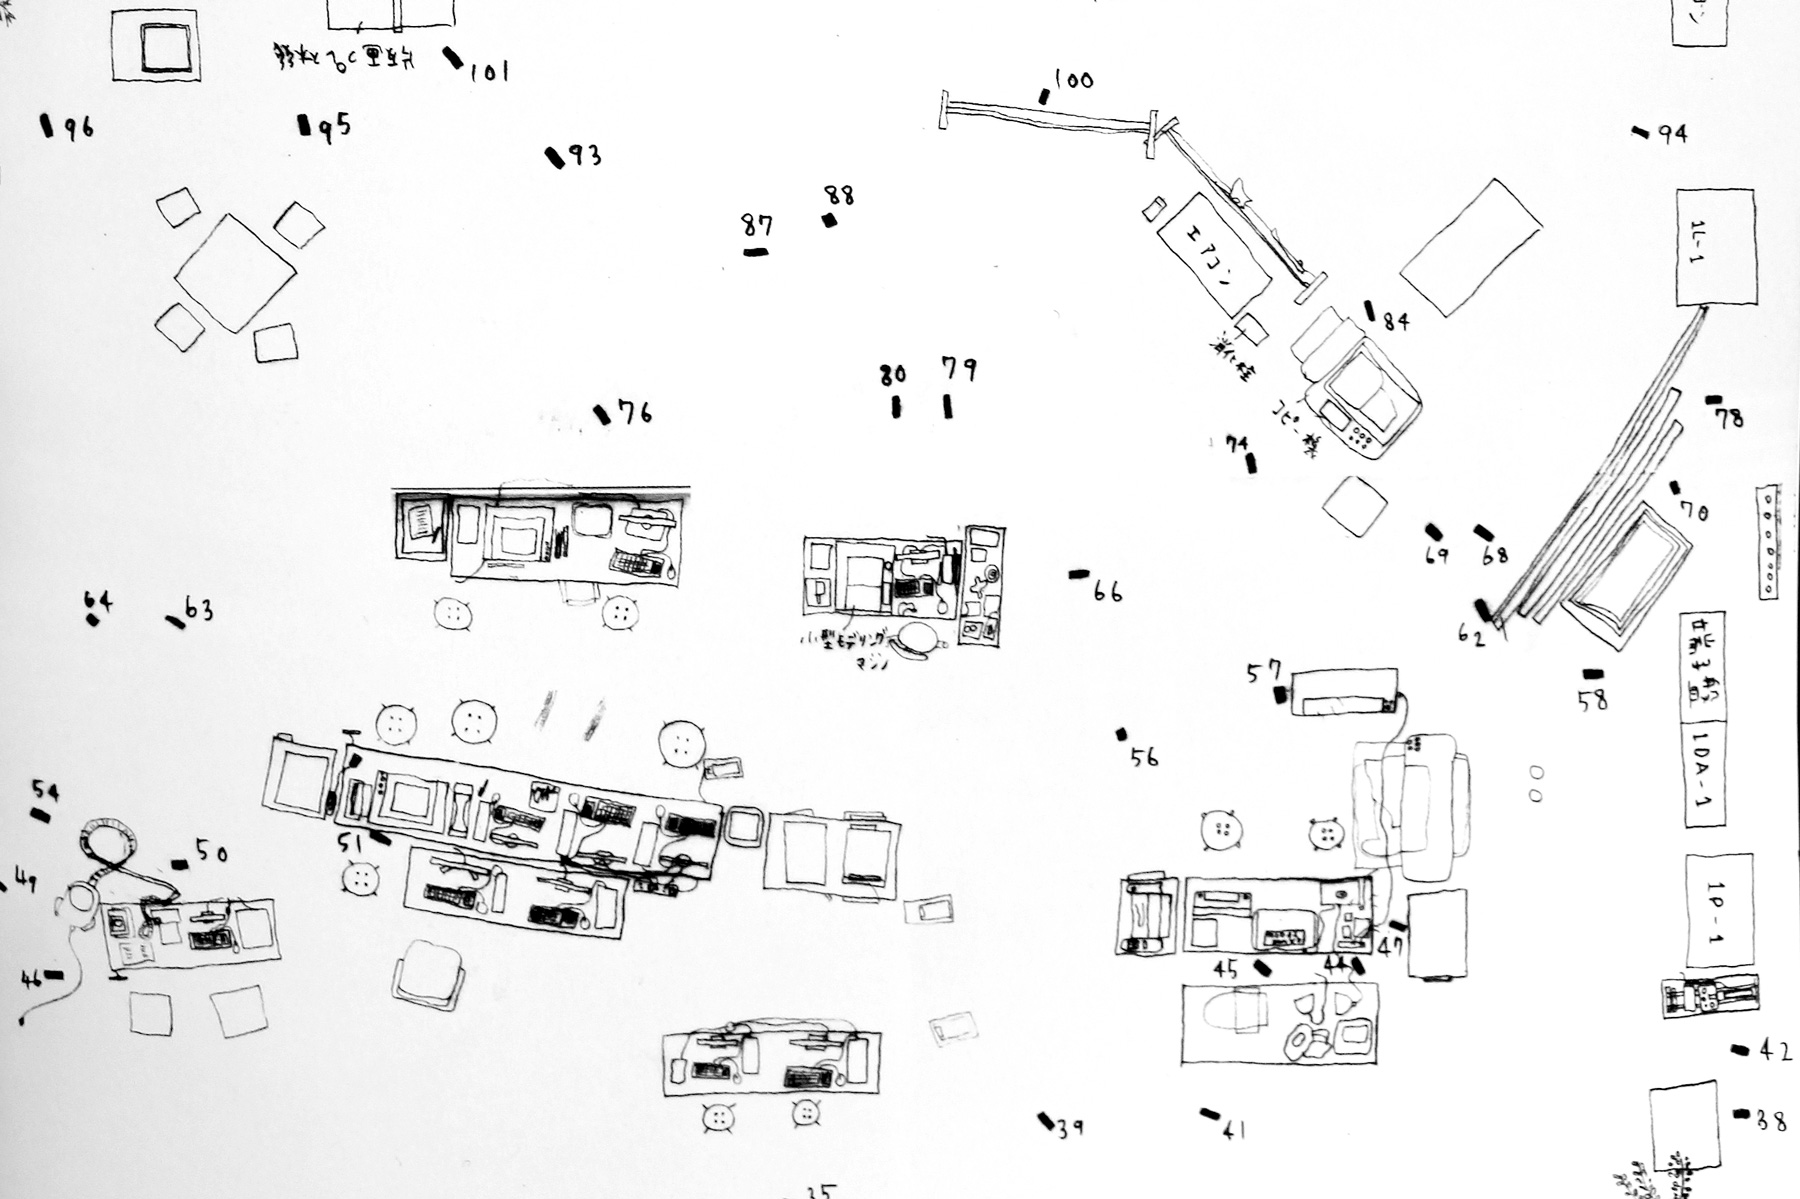
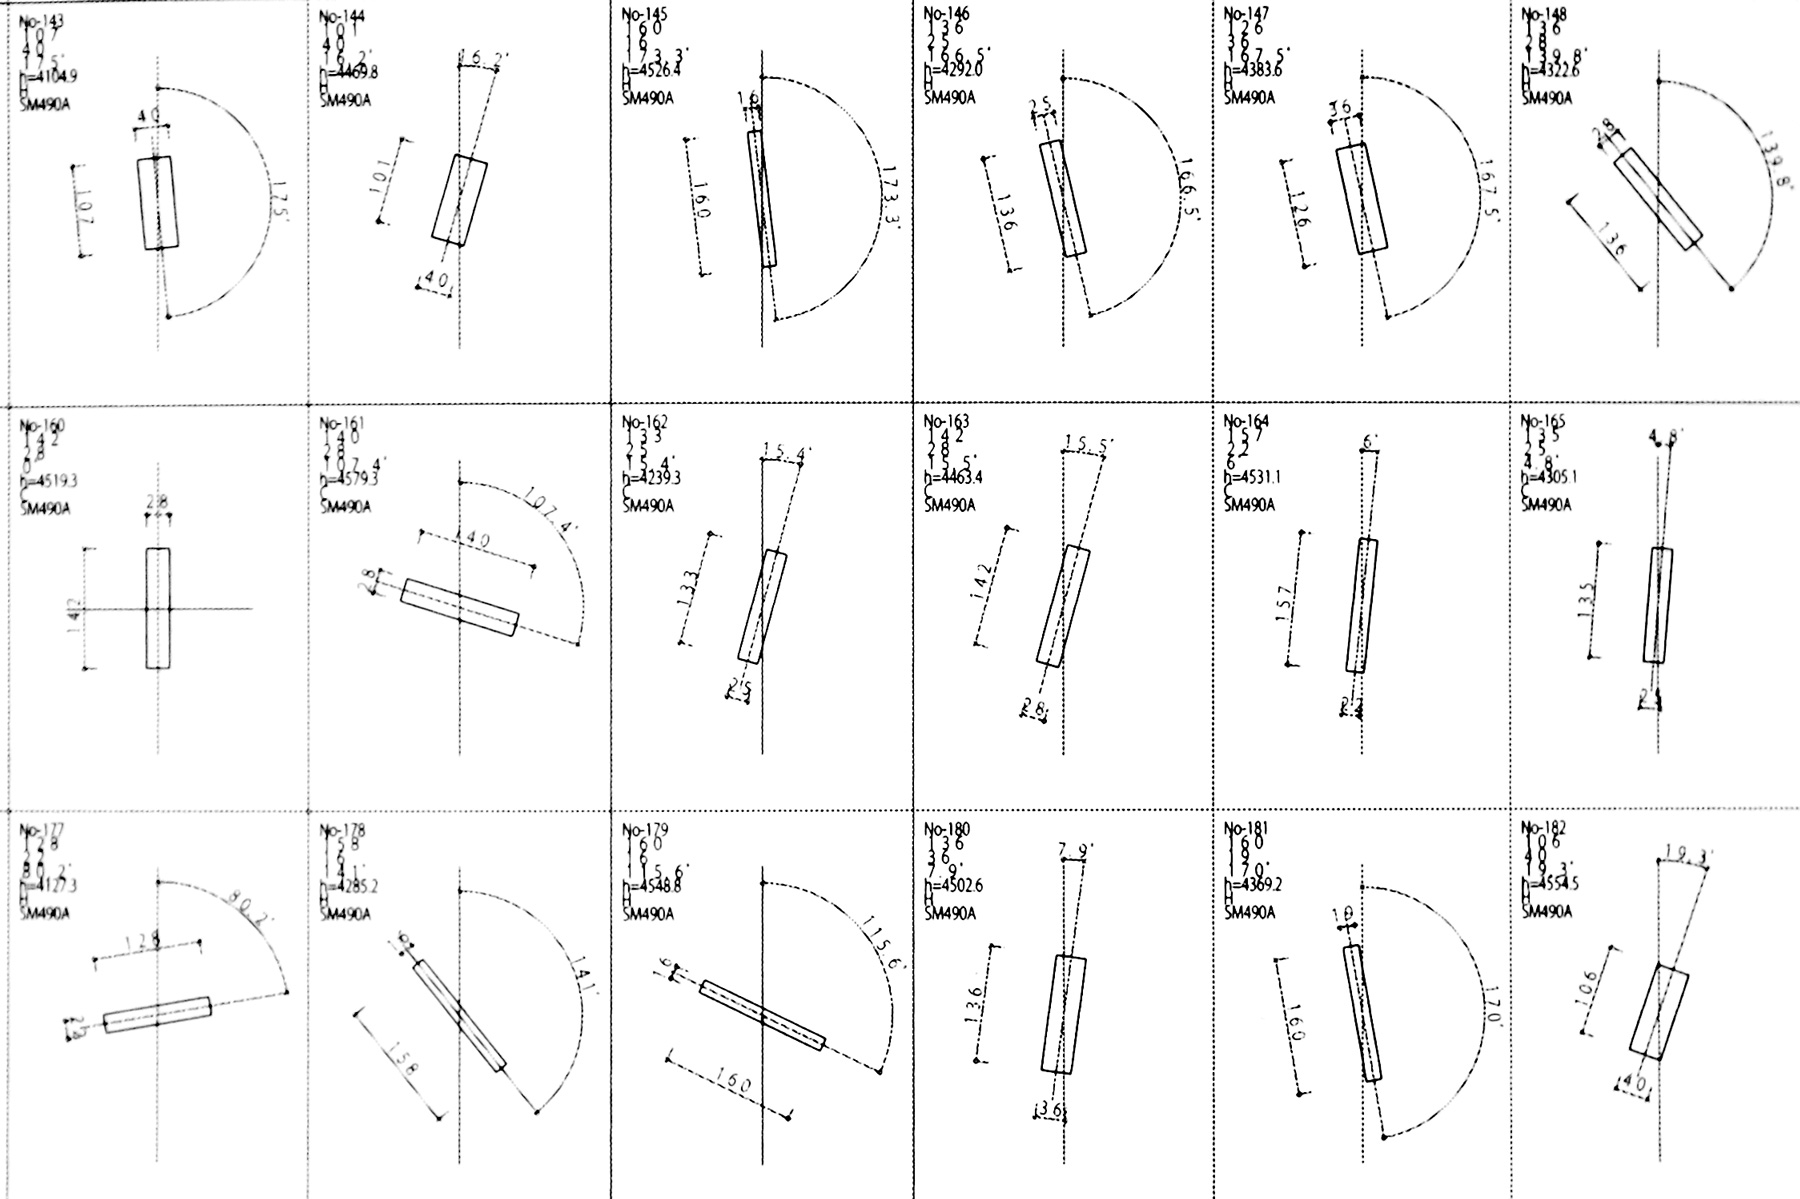
The spatial strategy for KAIT workshop is entirely based on the seemingly random distribution of structural elements whose exact location and orientation took years to determine. Rigorous studies in the course of the design process resulted in 290 variations of a quadrilateral unit section ranging from 16mmx145mm for the thinnest tension member to 63mmx90mm for the thickest stress member. Column permutations were tested iteratively during that phase using varied techniques: from hand drawings and CAD to scale models – more than 1000 in total.
The columns defined both the structural and the spatial configuration discribed by Junya Ishigami as “a multitude of places within the same space”.
The architect adopted the notion of ambiguity and conceived the building as if planning a forest. He introduced infinite variations and possibilities of walking paths and shaped a space that is percieved differently at any given point within the interior. The final bulding resulted from a continual process of fine-tuning multiple variables: from the section and orientation of the pillars to their variation in density and load-bearing capacity.
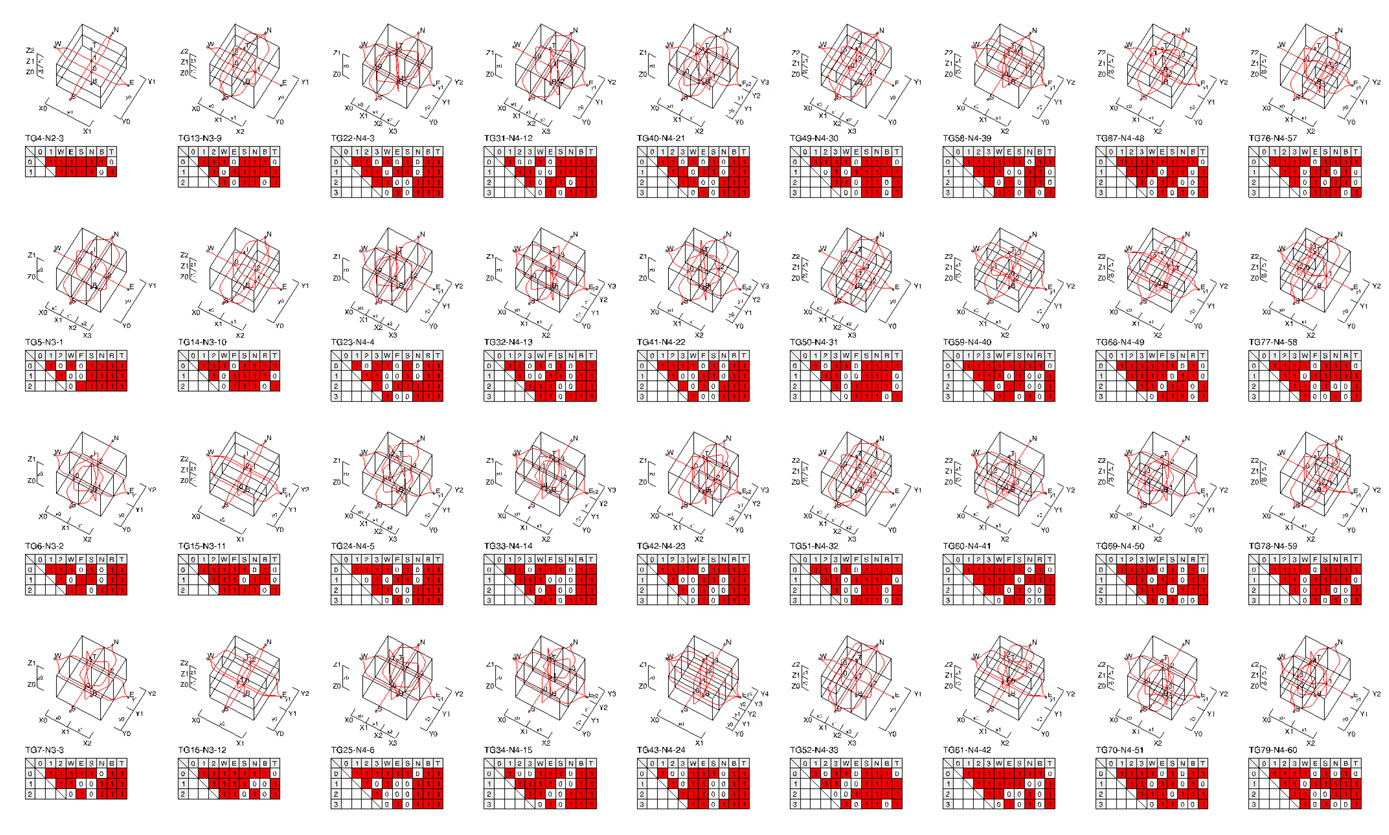
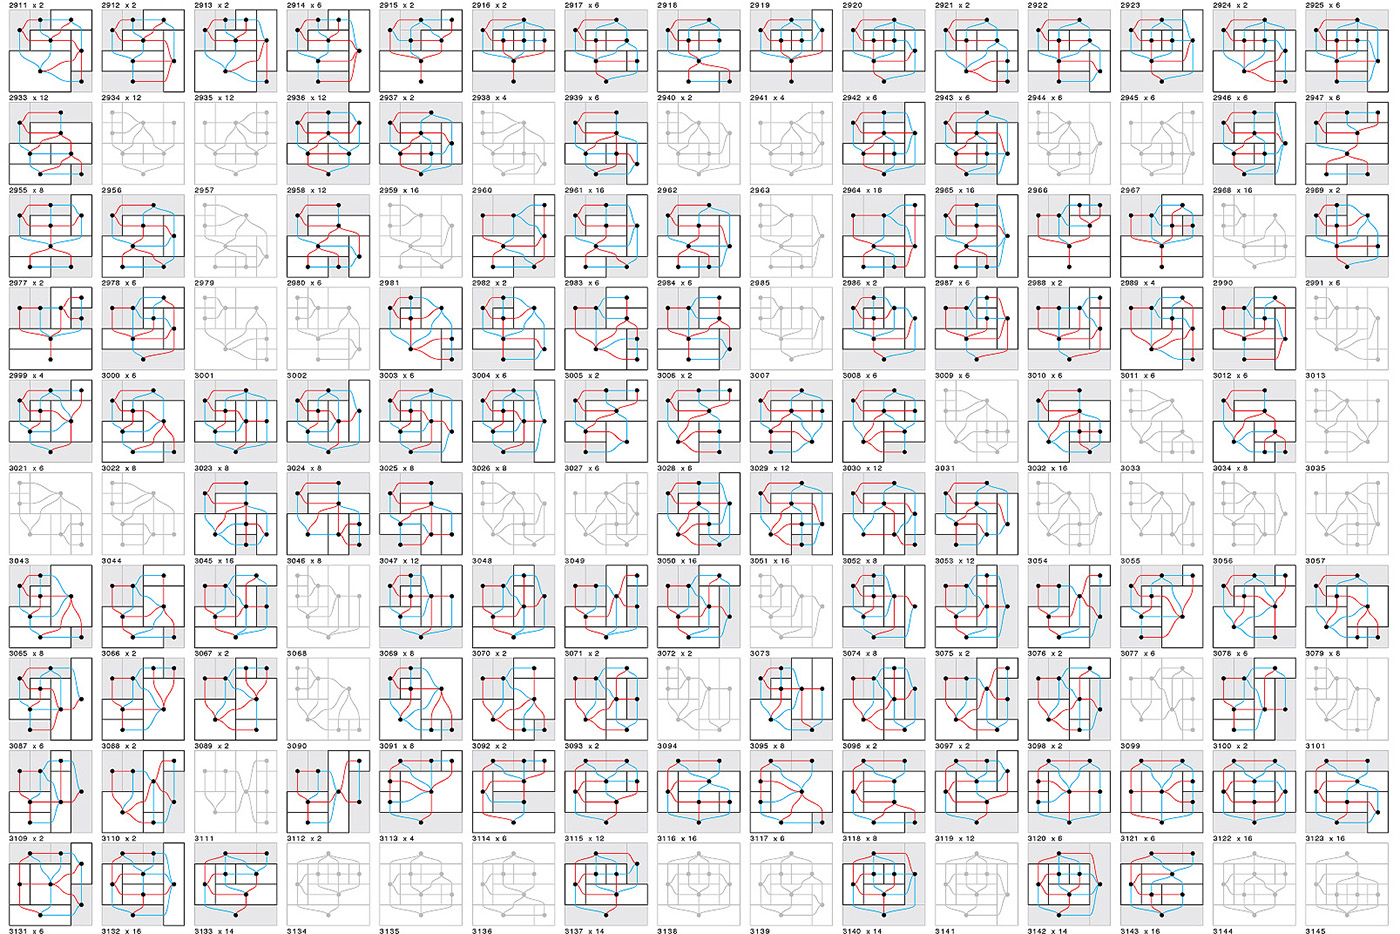

Topological Grid by Shohei Matsukawa
This last example is a concept by Shohei Matsukawa that proposes the use of a generalized algorithm – called Topological Grid in the design phase of an architecural project. Topological grid is a design system: it enables dynamic searching among finite possible solutions – each of them adapted to suit the given cotext.
Density, Scale and Type
The need to overcome data complexities while working with a multitude of constraints and parameters in an architectural program is what makes small multiples the best solution in many cases. They enable pattern recognition while introducing direct comparison and visual measure of variations. Besides all that, there are three notions built-in the logic of small multiples that make them extremely relevant for the visual display of architectural studies: the notions of density, scale and type.
“At the heart of quantitative reasoning is a single question: Compared to what?
Small multiple designs, multivariate and data bountiful, answer directly by visually enforcing comparisons of changes, of the differences among objects, of the scope of alternatives. For a wide range of problems in data presentation, small multiples are the best design solution. ”E. Tufte

I am glad you included my study
People on Staircase in Motion in your study. However my last name was misspelled it is Marshak, you omitted the s.
If you are interested in more images re the study please contact me
Best
Jerome Marshak
Dear Jerome,
Thank you for reaching out, we loved your work!
We appologize for the misspell and have fixed the typo.
Best,
Morphocode