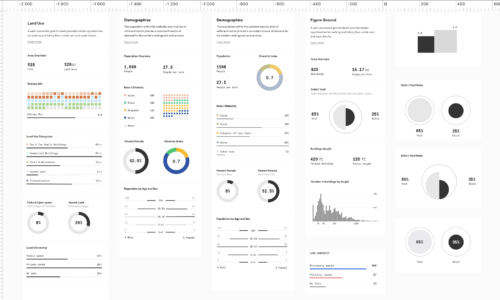
Over the last year, we’ve been working on a new web tool for interactive data [...]
Morphocode Explorer is an interactive web tool that combines various data sources and provides a [...]
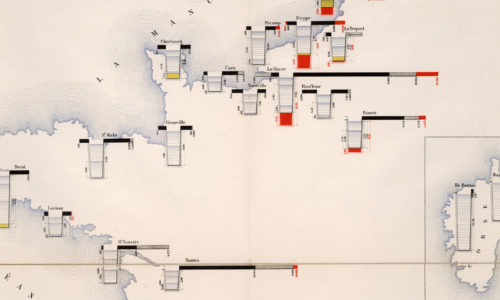
An inspirational selection of flow maps, graphic notations, imaginary cities and a blueprint for autonomous [...]
The most common ways to visually organize information are based on location and time. In [...]
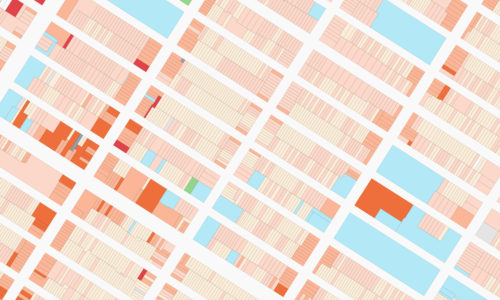
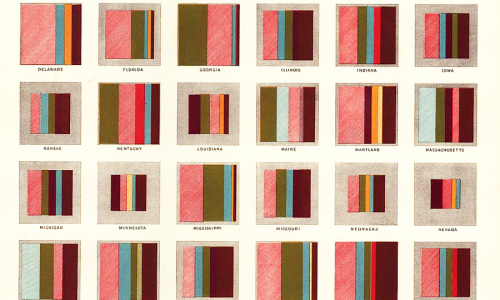
The use of color in maps and data visualizations has a long tradition. Color, along [...]
4 Comments
“Mapping Urban Data” will be the first in a series of video courses dedicated to [...]
6 Comments
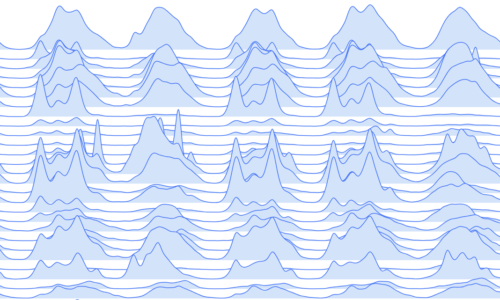
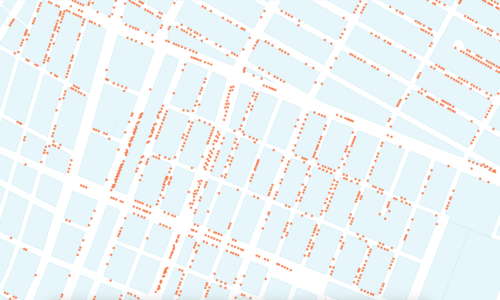
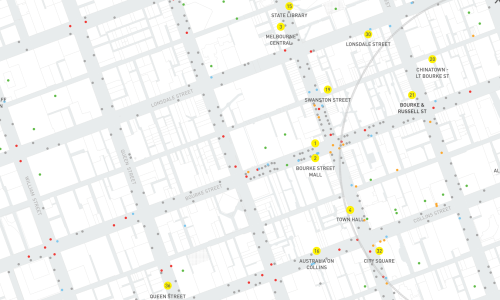
Pedestrian activity is a direct reflection of the city’s livability and vibrancy. The variety [...]
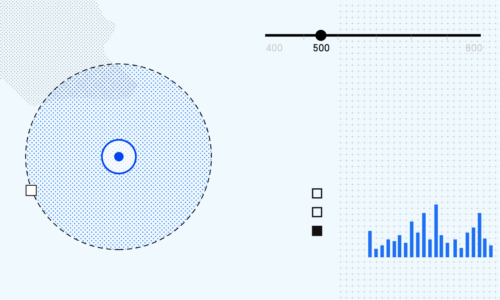
We refer to the process of making urban data visible, accessible and actionable as Data [...]
This is another post in the Morphocode Picks series, collecting some of the most interesting stuff that we’ve [...]
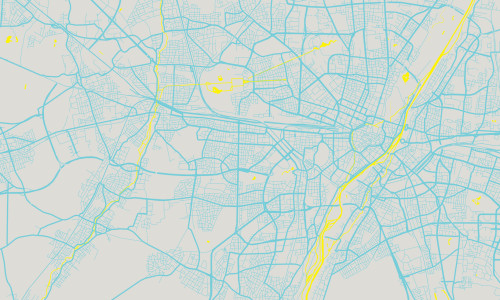
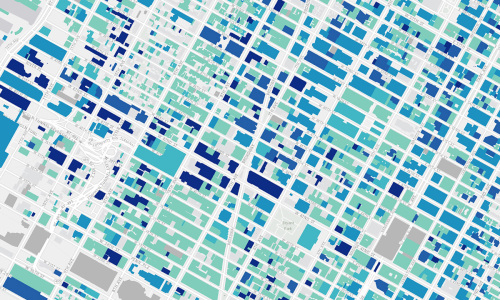
We recently announced our latest project Urban Layers – an interactive map that explores the [...]
Username
Password Forgot password?
Keep me signed in until I sign out
First name Last name
Email
Password