“Mapping Urban Data” will be the first in a series of video courses dedicated to exploring and visualizing data about cities. The course is coming soon on Morphocode Academy and will provide you with all the necessary skills to create web maps, work with data and explore urban insights.
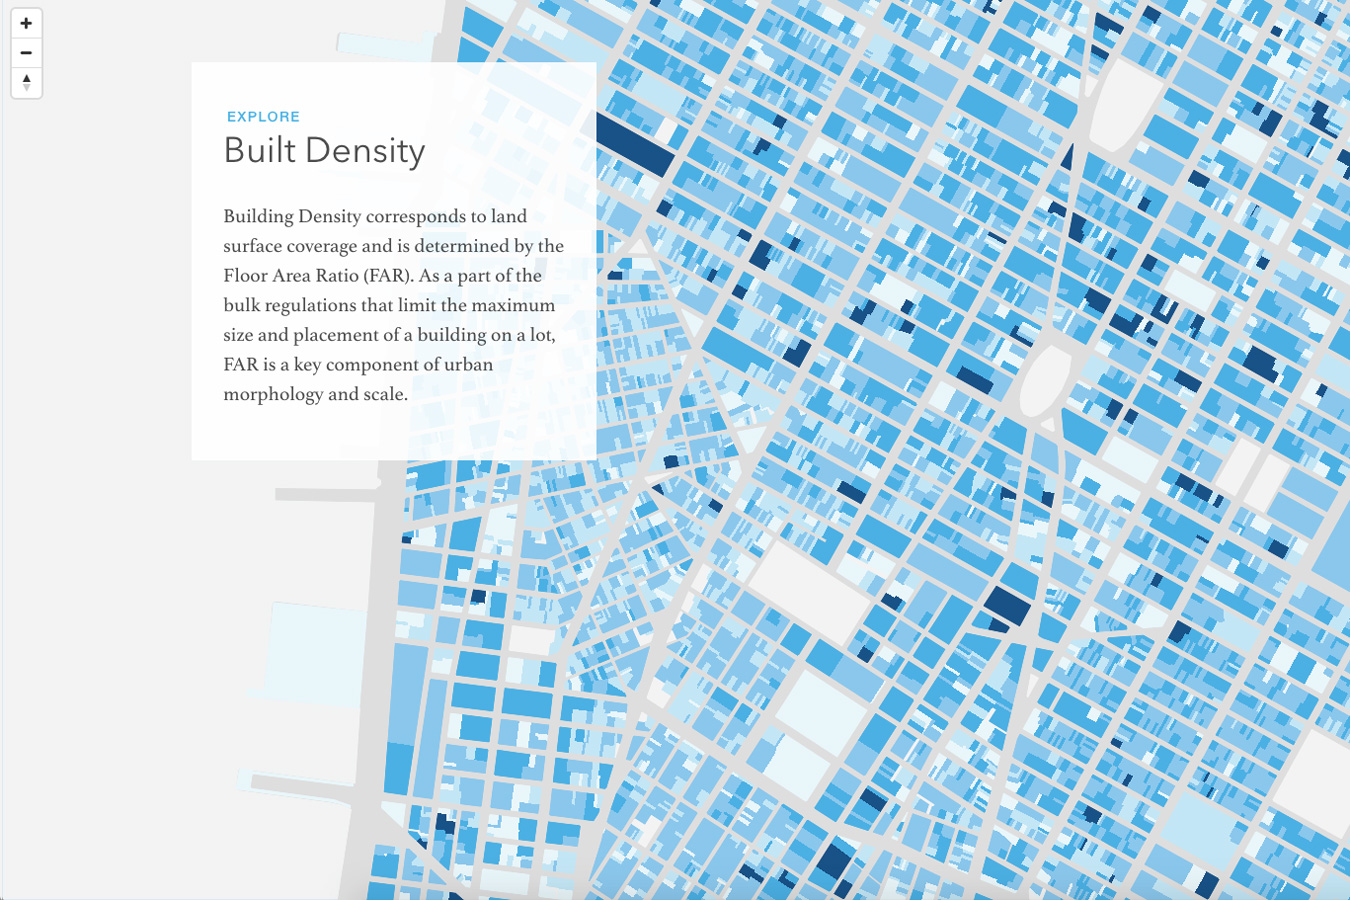
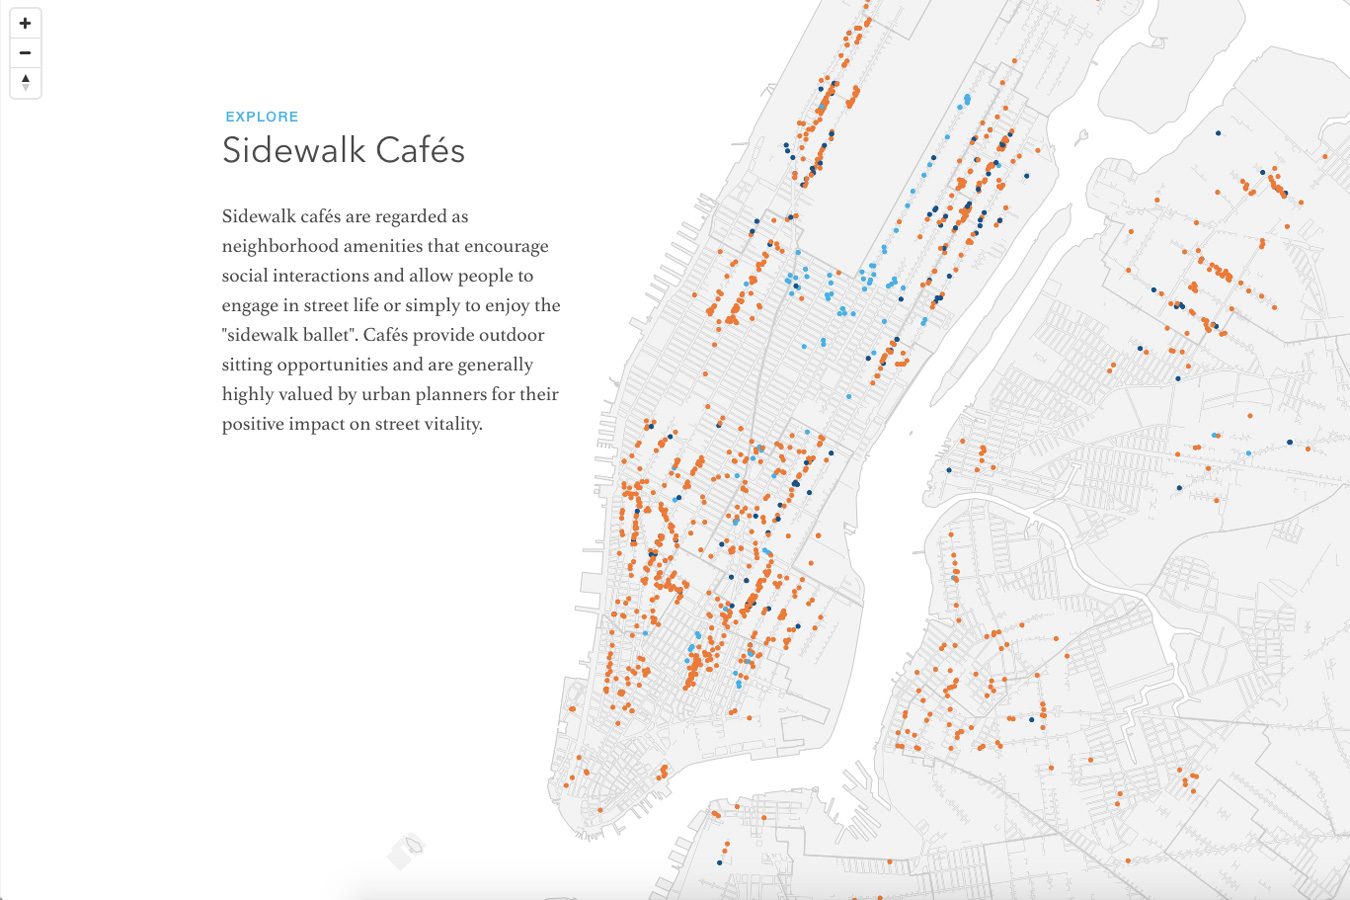
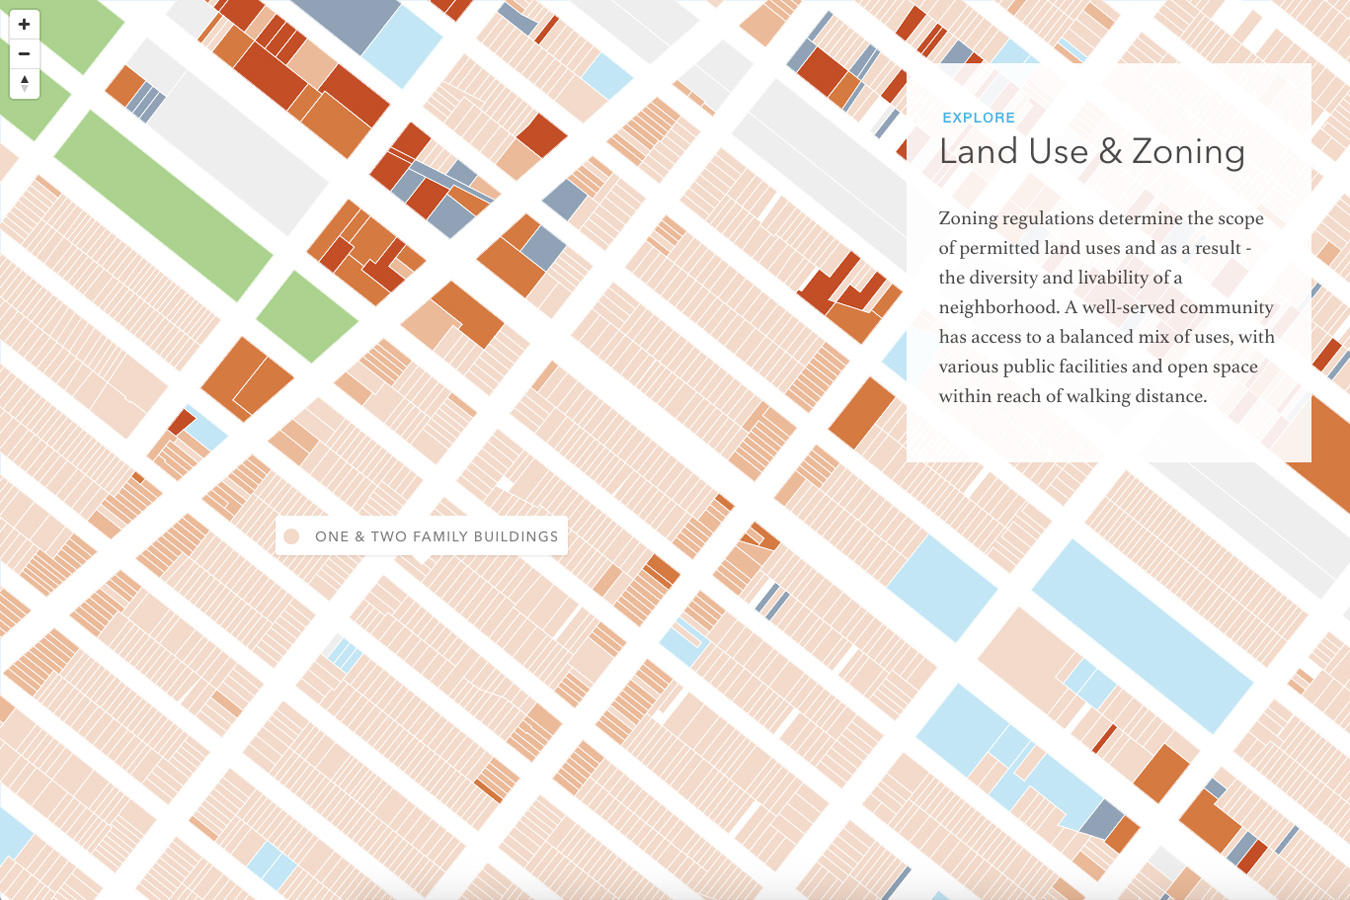
You will learn how to collect and use geospatial data, as well as how to style and publish your maps on the web. “Mapping Urban Data” takes a hands-on approach to data visualization through a range of New York City–based case studies covering topics such as built density, energy consumption and mobility.

Exploring the City: Case Study NYC
New York City is exemplary for its thorough use of data in urban analytics and policy evaluation. The success of large scale projects such as the reconstruction of Times Square; Green Light for Midtown and NYC Plaza Program is largely due to the data-driven approach applied by city departments. Currently, the Big Apple’s open data portal provides public access to over 1,500 datasets from various agencies, making the city a great starting point for data explorations.
The course will introduce you to interactive web mapping through one of New York city’s most valuable datasets – PLUTO. Containing detailed information on the tax lot level, PLUTO was first released to the open data community in 2013 and was considered a huge win. We will use PLUTO and a handful of other interesting datasets to explore urban insights and create interactive maps from the ground up.
Key Takeaways
“Mapping Urban Data” will guide you through a series of practical examples. You will start with a raw dataset, explore its attributes, design a map, add interactivity and finally publish it on the web. You will gain understanding of data formats, information design principles, cartography fundamentals and the coding skills required to finish the project.
The course is designed to be beginners-friendly and is suitable for architects, designers, urban planners, journalists or anyone genuinely interested in the topic. We will cover the following topics:
![]()
Data
Learn how to handle open data sets and common data formats such as CSV, GeoJSON and Shapefiles. Work your way through data fields, types and file formats.
![]()
Information Design
Create beautiful maps and data visualizations. Learn the fundamentals of information design, color scales, qualitative and quantitative maps.
![]()
Cartography
Transform data into maps. Handle map projections, inspect features, modify data attributes and style geometries.
![]()
Web Mapping
Export your visualizations for the Web. Learn the fundamentals: raster and vector map tiles, Web Mercator, zoom levels, feature collections.
![]()
Interaction
Provide additional levels of interactivity. Handle user interactions and design a functional interface for your visualization.
![]()
Code
Learn JavaScript, HTML5 and CSS and bring your data to life. Combine data, map and story into a single web page and share it with your friends.
The Big Picture: Data and the City
Rapid urbanization and advances in Information and communication technology are the most pervasive processes shaping the course of contemporary culture and society. “Data & The City” video series is about the intersection of these two global trends. As mobile devices become ubiquitous and spatial information even more abundant, data visualization allows a critical evaluation of active policies and city services by transforming otherwise hidden patterns into visual arguments. The act of transforming raw data into an interactive map creates visual narratives and opens up new possibilities for context-sensitive analysis conducted by urbanists, civic organizations, journalists and policy makers.
Course Update
The course page is now live, with detailed information about its content, structure and key takeaways!
Subscribe
The course is launching in 2017 with special discounts for subscribers to Morphocode Academy. You can subscribe in the form bellow and we will notify you when the course is available.

Great course, when and how can I register?
thank you Omar! We’ve replied on twitter: https://twitter.com/morphocode/status/810846781357641730
Best Regards!
Hi, I was wondering when are the classes going to start. Thanks
Hi Razvan,
Thank you for your interest in ” Mapping Urban Data”.
We are planning to launch the course by the end of February. It will contain over 30 videos resulting in hours of practical lessons on how to work with open data and transform it into an interactive web map. We may also launch a pre-order or a beta version in the next few weeks.
Best Regards,
Morphocode
Hi, is this course still available ? If it, how may I registered ?
Hi Maria,
The course is yet to be launched. You can subscribe for our newsletter and we will notify you when it is available. If you want to learn more about the structure and content of the course, you can also take a look at the preview here: https://morphocode.com/mapping-urban-data-course-preview/
Best Regards,
Morphocode